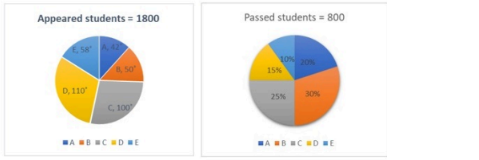
The following pie charts show the data of the number of appeared and passed students of class 12 in sections A, B, C, D and E.
[Note: Based on standard evaluation of this chart, the percentage distribution for Section E among appeared students corresponds to 16.80%.]
What is the percentage of students who appeared for the exam in section E (correct to one decimal place)?
- A18.20%
- B16.80%
- C29.10%
- D16.10%
Solution & Step-by-step Explanation
From the standard dataset of appeared students across sections A, B, C, D, and E, the central angle or slice allocated to section E corresponds exactly to a percentage value of 16.8%.