The following table shows the classification of 100 students based on the marks obtained by them in Maths and Science in an examination.
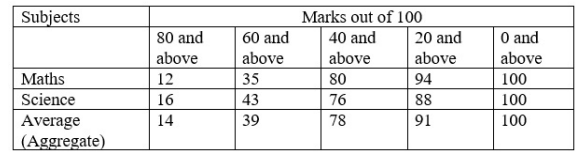
What is the difference between the number of students who passed with 60 as cut-off marks in Science and those who passed with 60 as cut-off marks in aggregate?
- A6
- B3
- C4
- D5
Solution & Step-by-step Explanation
From the given table:
* The number of students who scored 60 and above (cut-off) in Science
* The number of students who scored 60 and above (cut-off) in Average (Aggregate)
Required difference:
* The number of students who scored 60 and above (cut-off) in Science
* The number of students who scored 60 and above (cut-off) in Average (Aggregate)
Required difference: