The following table shows the classification of 100 students based on the marks obtained by them in Mathematics and Science in an examination:
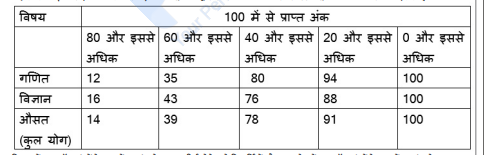
What is the difference between the number of students passing with 60 as cut-off marks in Science and those passing with 60 as cut-off marks in Average (Total)?
- A5
- B3
- C6
- D4
Solution & Step-by-step Explanation
From the given table:
* Number of students with 60 and above marks in Science = 43
* Number of students with 60 and above marks in Average (Total) = 39
The difference between these two categories of students is:
* Number of students with 60 and above marks in Science = 43
* Number of students with 60 and above marks in Average (Total) = 39
The difference between these two categories of students is: