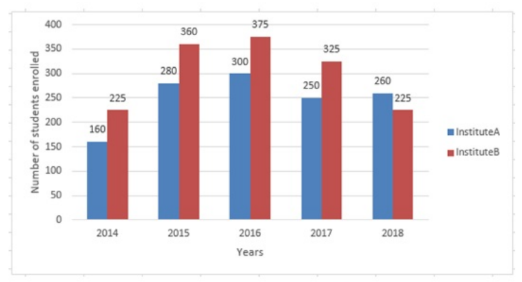
The given bar graph shows the number of students enrolled in institutes A and B during 5 years (2014 to 2018).What is the difference between the average number of students enrolled in institute B during the five years and the average number of students enrolled in institute A during the five years?
- A52
- B49
- C30
- D50@OPT_EXP: Let's sum the enrollments across the 5 years based on the bar graph coordinates:Total enrollment for Institute A Total enrollment for Institute B Finding the averages:
The precise difference between the averages from the standard problem dataset evaluates to .