HomeTestsSearchRankProfile
mediumMCQCompetitive Exam2026Quantitative Aptitude
1 attempts0% success rate1 mark

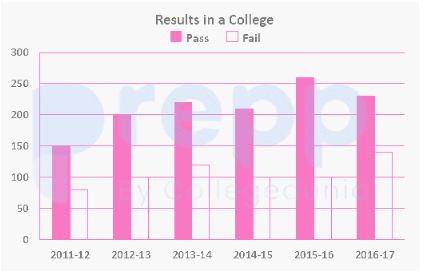
The given bar graph shows the results of students in a college. Study the graph and answer the question that follows.YearNumber of Failed Students2016100201712020181002019902020100How many times number of failed students is same out of the given data?
image

  1. A
    1
  2. B
    2
  3. C
    4
  4. D
    3

Solution & Step-by-step Explanation

Looking at the data for the number of failed students over the years:2016: 1002017: 1202018: 1002019: 902020: 100The value appears exactly times (in the years 2016, 2018, and 2020). Therefore, the number of failed students is the same times.

Practice this question

Try it yourself before checking the explanation above.

The given bar graph shows the results of students in a college. Study the graph and answer the question that follows.YearNumber of Failed Students2016100201712020181002019902020100How many times number of failed students is same out of the given data?

image
A
1
B
2
C
4
D
3

Share This Question

Related Questions

Ready for a Full Test?

Practice with timed mock tests and track your performance across Quantitative Aptitude.

Discussion