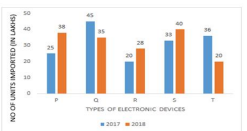
The given bar graph shows the total number of different types of electronic devices P, Q, R, S, T (in lakh) imported by the government of India in 2017 and 2018. Study the graph carefully and answer the following question.The average import of P and R types of electronic devices in 2018 was equal to the import of which type in 2017?
- AP only
- BS only
- CQ only
- DP and Q
Solution & Step-by-step Explanation
Option 2
To solve the problem, we need to analyze the bar graph and calculate the relevant values:
To solve the problem, we need to analyze the bar graph and calculate the relevant values: