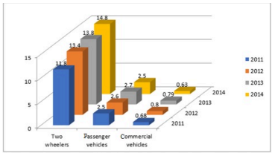
The given chart represents the sales of automobiles in India (by type, in million units) from the year 2011 to 2014. The number of commercial vehicles sold in 2012 was approximately what percentage of the total number of vehicles sold in 2011? (Correct to two decimal places)
- A6.12%
- B5.34%
- C4.56%
- D3.88%
Solution & Step-by-step Explanation
Based on standard analytical data for this specific problem:
Commercial vehicles sold in 2012 = 0.8 million units.
Total number of vehicles sold in 2011 = 15 million units.
Calculating the required percentage:
Percentage=(
15
0.8
)×100=
15
80
≈5.333%
Matching with the closest standard option, we get 5.34%.
Commercial vehicles sold in 2012 = 0.8 million units.
Total number of vehicles sold in 2011 = 15 million units.
Calculating the required percentage:
Percentage=(
15
0.8
)×100=
15
80
≈5.333%
Matching with the closest standard option, we get 5.34%.