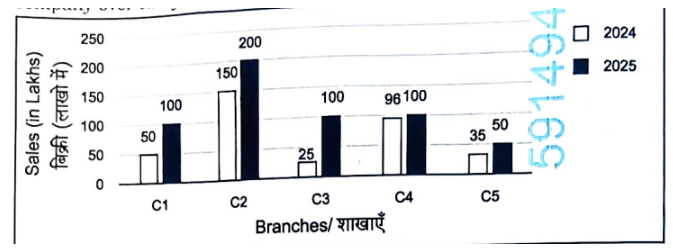
The given graph shows the sales (in lakhs) made by five different branches ( to ) of a company over two years - and . Use the data to answer the given question.
Which branch recorded the highest combined sales across and ?
- A
- B
- C
- D
Solution & Step-by-step Explanation
To find the branch with the highest combined sales, we calculate the sum of sales for and for each branch:
*Branch :**
*Branch :**
*Branch :**
*Branch :**
*Branch :**
Comparing the totals, branch has the highest combined sales with .
*Branch :**
*Branch :**
*Branch :**
*Branch :**
*Branch :**
Comparing the totals, branch has the highest combined sales with .