The graph which shows the variation of the de Broglie wavelength () of a particle and its associated momentum () is:
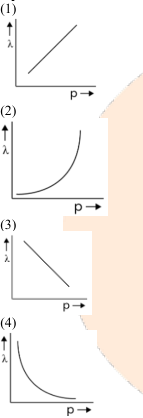
- A1
- B2
- C3
- D4
Solution & Step-by-step Explanation
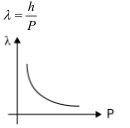
According to de Broglie's hypothesis, the wavelength associated with a particle of momentum is given by:
where is Planck's constant. Since is a constant, .The mathematical relation represents a rectangular hyperbola.