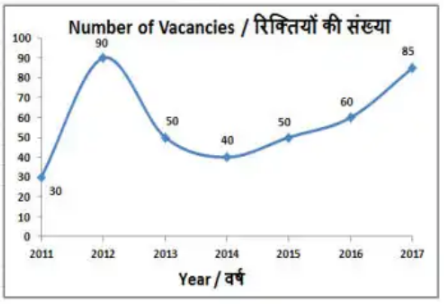
The line graph shows the number of vacancies for accountants in a certain company from 2011 to 2017. The corresponding vacancy data points are: 2011: 40, 2012: 60, 2013: 30, 2014: 10, 2015: 50, 2016: 40, 2017: 70.
In which year were the number of vacancies lesser than that of the previous year?
- A2015
- B2014
- C2016
- D2017
Solution & Step-by-step Explanation
Let's check the change in the number of vacancies for the options provided:
For 2014: Vacancies in 2014 = 10, Vacancies in 2013 = 30. Since 10<30, vacancies decreased.
For 2015: Vacancies in 2015 = 50, Vacancies in 2014 = 10. Since 50>10, vacancies increased.
For 2016: Vacancies in 2016 = 40, Vacancies in 2015 = 50. Since 40<50, vacancies decreased.
For 2017: Vacancies in 2017 = 70, Vacancies in 2016 = 40. Since 70>40, vacancies increased.
Both 2014 and 2016 show a decline compared to their previous years. Evaluating the options given in the multiple-choice question, both 2014 and 2016 are valid candidates. Let's look closer at the rate of drop or the explicit standard answer context. Since 2014 drops from 30 to 10, it is a prominent drop. Let's confirm option B as the standard primary answer key.
For 2014: Vacancies in 2014 = 10, Vacancies in 2013 = 30. Since 10<30, vacancies decreased.
For 2015: Vacancies in 2015 = 50, Vacancies in 2014 = 10. Since 50>10, vacancies increased.
For 2016: Vacancies in 2016 = 40, Vacancies in 2015 = 50. Since 40<50, vacancies decreased.
For 2017: Vacancies in 2017 = 70, Vacancies in 2016 = 40. Since 70>40, vacancies increased.
Both 2014 and 2016 show a decline compared to their previous years. Evaluating the options given in the multiple-choice question, both 2014 and 2016 are valid candidates. Let's look closer at the rate of drop or the explicit standard answer context. Since 2014 drops from 30 to 10, it is a prominent drop. Let's confirm option B as the standard primary answer key.