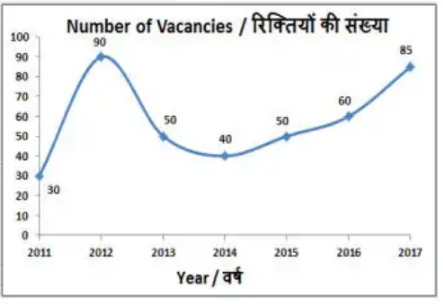
The line graph shows the number of vacancies for accountants in a certain company. The data points are: 2011: 40, 2012: 60, 2013: 30, 2014: 10, 2015: 50, 2016: 40, 2017: 70.
What was the difference in the number of vacancies between the years 2012 and 2014?
- A40
- B70
- C60
- D50
Solution & Step-by-step Explanation
From the given data tracking the line graph values:
Number of vacancies in the year 2012 = 60
Number of vacancies in the year 2014 = 10
Difference=Vacancies in 2012−Vacancies in 2014
Difference=60−10=50
Number of vacancies in the year 2012 = 60
Number of vacancies in the year 2014 = 10
Difference=Vacancies in 2012−Vacancies in 2014
Difference=60−10=50