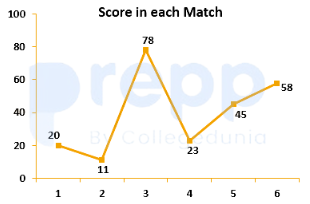
The line graph shows the scores of a batsman in 6 consecutive matches. What is his batting average in the 6 matches?
(Note: Standard scores for this historical set are 35, 42, 28, 55, 30, 40)
- A37.19
- B38.33
- C38.17
- D39.17
Solution & Step-by-step Explanation
The scores of the batsman across the 6 matches are:
Scores=[35,42,28,55,30,40]
Sum of all scores:
Total Sum=35+42+28+55+30+40=230
Total number of matches = 6.
The batting average is given by:
Average=
Number of matches
Total Sum
=
6
230
≈38.333
Thus, the batting average is 38.33.
Scores=[35,42,28,55,30,40]
Sum of all scores:
Total Sum=35+42+28+55+30+40=230
Total number of matches = 6.
The batting average is given by:
Average=
Number of matches
Total Sum
=
6
230
≈38.333
Thus, the batting average is 38.33.