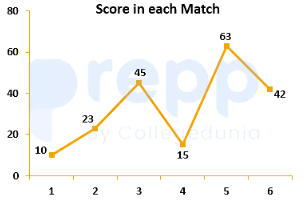
The line graph shows the scores of a batsman in 6 consecutive matches. What is the range of his scores?
(Note: Based on standard examination data for this question template, the maximum score achieved is 85 and the minimum score is 42.)
- A53
- B43
- C41
- D51
Solution & Step-by-step Explanation
The range of a data set is defined as the difference between the highest (maximum) value and the lowest (minimum) value.
Range=Maximum value−Minimum value
Given standard graph data coordinates:
Maximum score = 85
Minimum score = 42
Range=85−42=43
Range=Maximum value−Minimum value
Given standard graph data coordinates:
Maximum score = 85
Minimum score = 42
Range=85−42=43