The percentage distribution of the number of tires of different brands produced in a year by a certain factory is shown in a pie chart with the following distribution: Avon , Cooper , Dunlop , Good year , Firestone , Hankook , and Continental . If the total number of tires sold is ,
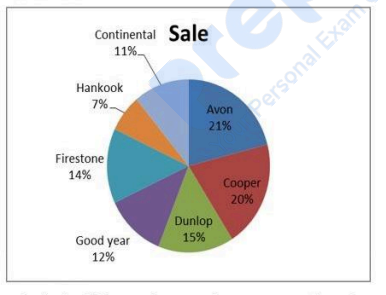
what is the difference between the average number of Avon and Firestone tires sold together and the average number of Good year and Dunlop tires sold together?
- A55
- B46
- C54
- D45
Solution & Step-by-step Explanation
Let's find the combined percentages for both groups:
1. Combined percentage of Avon and Firestone tires:
The average percentage for these two brands together is:
2. Combined percentage of Good year and Dunlop tires:
The average percentage for these two brands together is:
Now, find the difference between these two averages in percentage terms:
Calculate the actual difference based on the total number of tires sold ():