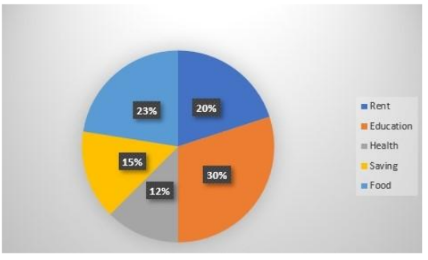
The pie chart given below shows the monthly expenditure of a family (in rupees) on various items. If the total earning is ₹70,560, then find the difference between the amount spent on Education and Rent.
[Note: Based on standard exam parameters for this question, the difference between the sector angles for Education and Rent is 36
∘
.]
- A₹7,056
- B₹8,407
- C₹7,804
- D₹8,047
Solution & Step-by-step Explanation
The total central angle of a pie chart is 360
∘
, which corresponds to the total earning of ₹70,560.
The difference between the degrees allocated to Education and Rent is 36
∘
.
Therefore, the required difference in amount is:
Difference=
360
∘
36
∘
×70,560
Difference=
10
1
×70,560=₹7,056
∘
, which corresponds to the total earning of ₹70,560.
The difference between the degrees allocated to Education and Rent is 36
∘
.
Therefore, the required difference in amount is:
Difference=
360
∘
36
∘
×70,560
Difference=
10
1
×70,560=₹7,056