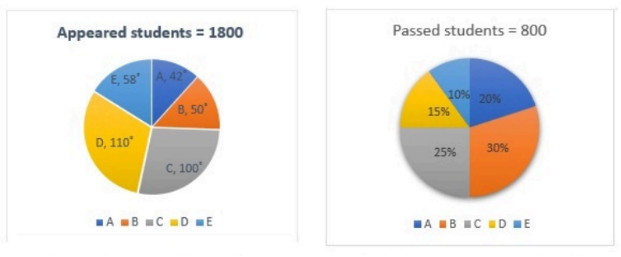
The pie chart shows the breakdown of students who appeared for the exam across different sections. Total appeared = 1000. Section A represents 20% and Section B represents 25%. Find the difference between the number of students who appeared for the exam in sections A and B.
- A30
- B60
- C50
- D40
Solution & Step-by-step Explanation
Difference in percentage between sections A and B = Total appeared students = 1000.