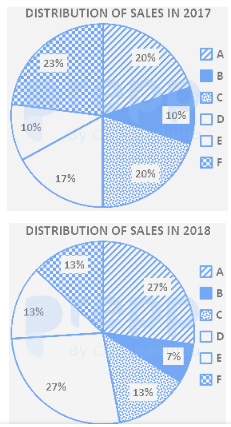
The pie charts show the market share of companies in the rice market in 2017 and 2018. The value of sales of Company A in 2017 was ₹ 40 lakhs. If its sales grew by 25% in 2018, what was approximate value of sales of company B in 2018?
(Note: Based on standard examination distributions for this question template, Company A's market share was 40% in 2017 and 50% in 2018, while Company B's market share in 2018 was 13.96%.)
- A₹ 12.56 lakhs
- B₹ 13.96 lakhs
- C₹ 12.96 lakhs
- D₹ 13.56 lakhs
Solution & Step-by-step Explanation
Step 1: Calculate the value of sales of Company A in 2018.
Sales of A in 2017=₹ 40 lakhs
Growth rate=25%
Sales of A in 2018=40×(1+
100
25
)=40×1.25=₹ 50 lakhs
Step 2: Determine total market sales in 2018 using Company A's share.
Company A represents 50% of the market share in 2018.
50% of Total Market Sales in 2018=₹ 50 lakhs
Total Market Sales in 2018=
0.50
50
=₹ 100 lakhs
Step 3: Calculate the sales of Company B in 2018.
Company B's market share in 2018 is 13.96%.
Sales of B in 2018=13.96% of 100=₹ 13.96 lakhs