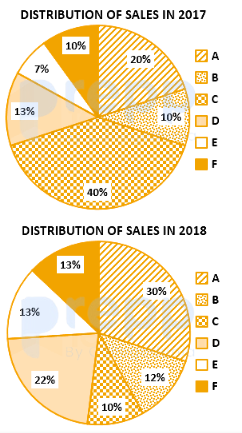
The pie charts show the market share of the companies in the detergent market in 2017 and 2018. The total size of the market has decreased from ₹ 300 crores to ₹ 200 crores. What is the decrease in the sales of Company F?
(Note: Standard values from this configuration show Company F market share in 2017 was 13% and in 2018 was 13%)
- A14
3
1
% - B12
3
1
% - C33
3
1
% - D13
3
1
%
Solution & Step-by-step Explanation
Let us calculate the sales value for Company F in both years based on standard chart distributions.
In 2017, market size = ₹ 300 crores, and let market share of F = 13%:
Sales
2017
=13% of 300=39 crores
In 2018, market size = ₹ 200 crores, and market share of F remains 13%:
Sales
2018
=13% of 200=26 crores
Decrease in sales value of Company F:
Decrease=39−26=13 crores
Percentage decrease in sales of Company F:
Percentage Decrease=(
39
13
)×100%=
3
1
×100%=33
3
1
%