The velocity () – time () plot of the motion of a body is shown below. The graph starts from origin, increases linearly to a peak, then decreases linearly to zero velocity at a later time.
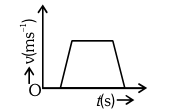
The acceleration () – time () graph that best suits this motion is:
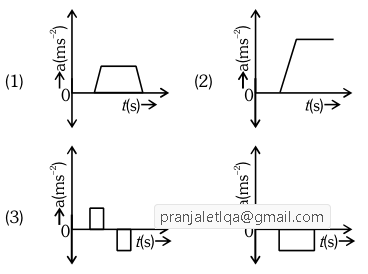
- A1
- B2
- C3
- D4
Solution & Step-by-step Explanation
Acceleration is the slope of the graph ().In the first part, velocity increases linearly slope is positive and constant. Thus, is constant and positive.In the second part, velocity decreases linearly slope is negative and constant. Thus, is constant and negative.The graph will show a positive constant block followed by a negative constant block. This corresponds to option (3).