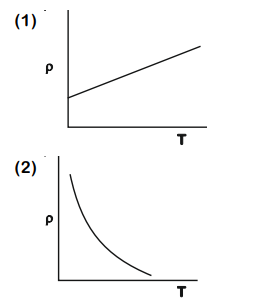
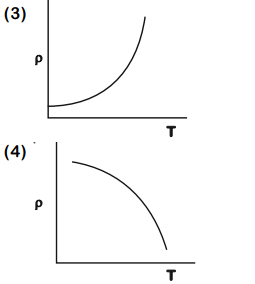
Which of the following graph represents the variation of resistivity () with temperature () for copper?
- A1
- B2
- C3
- D4
Solution & Step-by-step Explanation
For metals like copper, resistivity increases with temperature. At very low temperatures, the increase is non-linear (parabolic/exponential-like), while at higher temperatures, it becomes linear. The standard graph for copper shows a curve that bends upwards as temperature increases from absolute zero.