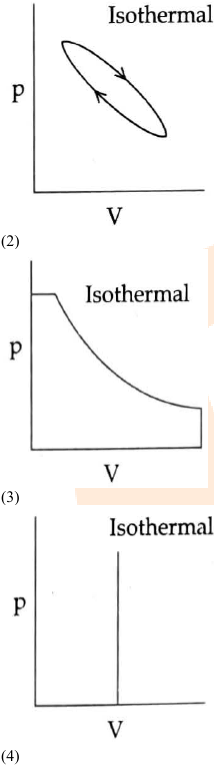
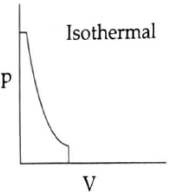
Which of the following curves represents maximum work done?
(1)
- A1
- B2
- C3
- D4
Solution & Step-by-step Explanation
Work done in a diagram is equal to the area under the curve. For the same initial and final volumes, a process that maintains a higher pressure throughout the expansion will have a larger area. In most comparative problems, the reversible isothermal expansion (or a specific irreversible path with a large area) provides maximum work. Based on the Paper Code Q6 options:Option 2 (the graph covering the largest area) represents maximum work.