HomeTestsSearchRankProfile

Table Charts Questions

Practice 6 Table Charts questions with detailed answers and explanations. Free MCQs, PYQs, and mock test questions for NEET, JEE, GATE, SSC and more.

📚
6
Total Questions
🟢
0
Easy
🟡
6
Medium
🔴
0
Hard

About Table Charts — practice questions, PYQs & concepts

Table Charts is a frequently-tested topic on Quantitative Aptitude, Data Interpretation. ExamTest.live currently lists 6 Table Charts questions spanning previous-year papers from 2026 to 2026, each with worked solutions and a step-by-step explanation. Use the filters on this page to focus on a specific exam, difficulty level or year — every answer key is free, no sign-up required.

Table Charts weight in competitive exams

Across our Table Charts question bank, the largest sources are Quantitative Aptitude (5) and Data Interpretation (1). Click any exam chip above to drill down to that exam-specific question set.

How to use this page

  • Start easy: 0 easy Table Charts questions are available — build fluency before moving up.
  • Target weak years: Use the year filter to focus on the most recent 2026 paper or older PYQs you have not attempted.
  • Time yourself: Every question shows the average solve time so you can benchmark your speed against other students.
  • Read every explanation: Even on questions you got right — the explanation often surfaces a faster approach you can reuse.
All Table Charts Questions(16 of 6)

Filter:
Q1mediummcqQuantitative AptitudeCompetitive Exam2026
7% accuracy
The following table shows the production of some products. What is the value of 'X'?ProductJulyAugustSeptemberOctoberTotalA1216201462B15X131661C1114171860
Q2mediummcqQuantitative AptitudeSSC CGL2026
Refer the below data table and answer the following Question.
Q3mediummcqQuantitative AptitudeSSC CGL2026
Refer the below data table and answer the following Question.
Designation Number of employees Annual salary (in lakhs) Bonus as percent of annual salary
Manager 3 30 30%
Executive 8 16 20%
Trainee 4 2 20%
What is the average bonus (in rupees)?
Q4mediummcqQuantitative AptitudeSSC CGL2026
Refer the below data table and answer the following Question.
Company 2011 2012 2013 2014 2015
Company A 3000 5000 4000 5000 5000
Company B 1000 1000 1000 2000 2000
Company C 4000 2000 2000 2000 3000
For which of the following pairs of years the total exports from the three Companies together are equal?

(Note: Figures given are in lakh rupees)
Q5mediummcqQuantitative AptitudeSSC CGL2026
Refer the below data table and answer the following Question.
India's exports in 2015

Category Value in million US$
Jewellery 675
Software 500
Cotton 525
Steel 575
Electronics 725
Jewellery was what percent of total exports?
Q6mediummcqData InterpretationCompetitive Exam2026
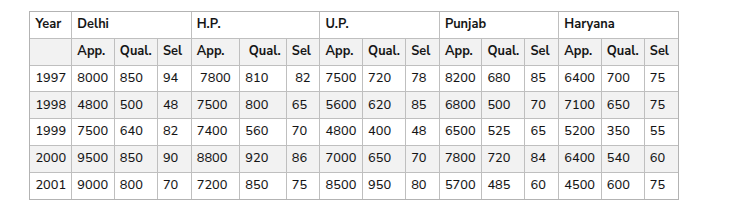
Study the following table and answer the question based on it:
**Number of Candidates Appeared, Qualified and Selected in a Competitive Examination from Five States Delhi,
image

In the year 1997, which state had the lowest percentage of candidates selected over the candidates appeared?

Frequently Asked Questions

How many Table Charts questions are on ExamTest.live?
We have 6 Table Charts questions spread across 1 pages, covering easy, medium, and hard difficulty levels with detailed explanations.
Are Table Charts MCQs free?
Yes. All Table Charts questions, answers, and explanations on ExamTest.live are completely free. No account or subscription required.
Which exams include Table Charts questions?
Table Charts questions are commonly asked in Quantitative Aptitude, Data Interpretation. You can filter by exam using the links above.
How do I practice Table Charts questions effectively?
Start with easy questions to build confidence, then tackle medium and hard ones. Use the filter buttons to sort by difficulty. Reveal the answer only after attempting each question, and read the explanation thoroughly.