100% Free
SSC Selection Post 2020 Higher Secondary Level Question Paper (06 Nov, 2020) (Shift 3)
Medium 100 Questions 180 min 100 marks
⚡ Live Test Mode Available
Take this as a timed mock test
180 min · 100 marks · Full test mode with leaderboard
Advertisement
Mock Test Questions
100medium5
Questions
0
Attempted
0
Correct
0
Wrong
0/5 attempted
Question No: 1Difficulty: mediumMarks: 1mcq
Read the following information carefully and answer the question given below:
'A + B' means 'A is the father of B'
'A - B' means 'A is the husband of B'
'A × B' means 'A is the daughter of B'
'A ÷ B' means 'A is the sister of B'
If P + M ÷ Q × N × T - U, then how is P related to N?
'A + B' means 'A is the father of B'
'A - B' means 'A is the husband of B'
'A × B' means 'A is the daughter of B'
'A ÷ B' means 'A is the sister of B'
If P + M ÷ Q × N × T - U, then how is P related to N?
Question No: 2Difficulty: mediumMarks: 1mcq
In a certain language, FUTILE is written as EGTVSUHJKMDF. How will HELPFUL be written in that language?
Question No: 3Difficulty: mediumMarks: 1mcq
Select the correct mirror image of the given combination when the mirror is placed on the right side of it.
[Note: The question refers to standard alphanumeric combination mirror imaging.]

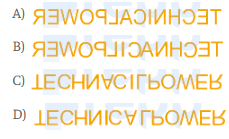
[Note: The question refers to standard alphanumeric combination mirror imaging.]
Question No: 4Difficulty: mediumMarks: 1mcq
Select the interchanges in numbers and signs that will make the given equation correct.
5÷10×12+14−7=88
5÷10×12+14−7=88
Question No: 5Difficulty: easyMarks: 1mcq
If 'Respect' is related to 'Offend' in the same way as 'Fragile' is related to '______'.
✓ Showing questions 1–5 of 100 — use the page buttons below to practice the rest
You May Also Like
📊 Track Your Progress
Know exactly where you stand
Save scores, track weak topics, compare with toppers — all free.
Advertisement