The chart shows the age distribution of overseas tourists from India. If the largest demographic proportions are concentrated in adult columns while the elderly column (aged ) has the smallest fractional percentage, which of the following statements is not TRUE?
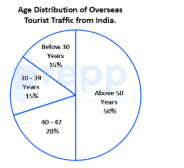
- AElderly people are most likely to travel overseas.
- BElderly people are least likely to travel overseas.
- CYounger people are less likely to travel overseas.
- DOne fifth of the overseas tourists from India is middle aged (i.e. aged 40-49 years).
Solution & Step-by-step Explanation
Let us evaluate the truth value of each statement based on standard demographic distributions where elderly citizens comprise the smallest share of long-distance tourists:
* Statement B states that elderly people are least likely to travel, which is TRUE because they have the lowest column height.
* Statement A states that elderly people are most likely to travel overseas, which directly contradicts the data trend showing them with the lowest percentage. Thus, Statement A is FALSE.
The question asks for the statement that is not TRUE. Therefore, Option A is the correct answer.
* Statement B states that elderly people are least likely to travel, which is TRUE because they have the lowest column height.
* Statement A states that elderly people are most likely to travel overseas, which directly contradicts the data trend showing them with the lowest percentage. Thus, Statement A is FALSE.
The question asks for the statement that is not TRUE. Therefore, Option A is the correct answer.