HomeTestsSearchRankProfile

Charts Questions

Practice 3 Charts questions with detailed answers and explanations. Free MCQs, PYQs, and mock test questions for NEET, JEE, GATE, SSC and more.

📚
3
Total Questions
🟢
1
Easy
🟡
2
Medium
🔴
0
Hard

About Charts — practice questions, PYQs & concepts

Charts is a frequently-tested topic on Quantitative Aptitude, Data Interpretation. ExamTest.live currently lists 3 Charts questions spanning previous-year papers from 2026 to 2026, each with worked solutions and a step-by-step explanation. Use the filters on this page to focus on a specific exam, difficulty level or year — every answer key is free, no sign-up required.

Charts weight in competitive exams

Across our Charts question bank, the largest sources are Quantitative Aptitude (2) and Data Interpretation (1). Click any exam chip above to drill down to that exam-specific question set.

How to use this page

  • Start easy: 1 easy Charts questions are available — build fluency before moving up.
  • Target weak years: Use the year filter to focus on the most recent 2026 paper or older PYQs you have not attempted.
  • Time yourself: Every question shows the average solve time so you can benchmark your speed against other students.
  • Read every explanation: Even on questions you got right — the explanation often surfaces a faster approach you can reuse.
All Charts Questions(13 of 3)

Filter:
Q1easymcqQuantitative AptitudeAdda2472026
Which chart type is used to represent the relationship between two variables?
Q2mediummcqQuantitative AptitudeCompetitive Exam2026
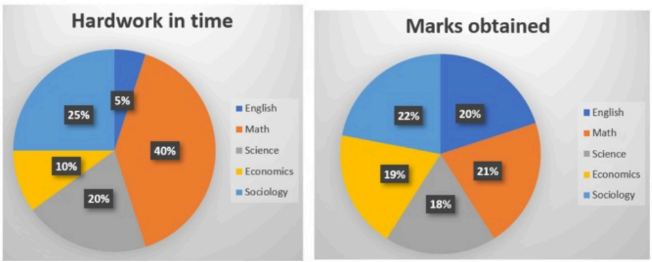
A student has 5 subjects in an examination. The distribution of hard work of 16 hours a day over 5 subjects and marks obtained 400 out of 500 are shown in the charts. In which subject did the student get the highest outcome of the hard work (ratio of marks to hard work is highest)?

image
Q3mediummcqData InterpretationCompetitive Exam2026
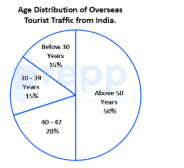
The chart shows the age distribution of overseas tourists from India. If the largest demographic proportions are concentrated in adult columns while the elderly column (aged ) has the smallest fractional percentage, which of the following statements is not TRUE?

image

Frequently Asked Questions

How many Charts questions are on ExamTest.live?
We have 3 Charts questions spread across 1 pages, covering easy, medium, and hard difficulty levels with detailed explanations.
Are Charts MCQs free?
Yes. All Charts questions, answers, and explanations on ExamTest.live are completely free. No account or subscription required.
Which exams include Charts questions?
Charts questions are commonly asked in Quantitative Aptitude, Data Interpretation. You can filter by exam using the links above.
How do I practice Charts questions effectively?
Start with easy questions to build confidence, then tackle medium and hard ones. Use the filter buttons to sort by difficulty. Reveal the answer only after attempting each question, and read the explanation thoroughly.