The graph between angle of deviation () and angle of incidence () for a triangular prism is represented by:
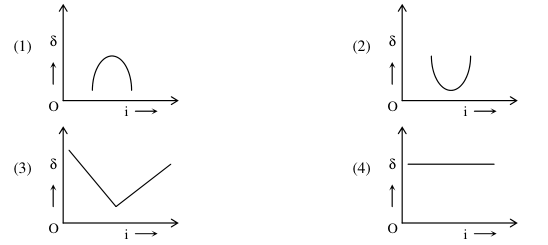
- A1
- B2
- C3
- D4
Solution & Step-by-step Explanation
For a prism, as the angle of incidence increases, the deviation first decreases, reaches a minimum (), and then increases. The curve is non-linear and U-shaped (specifically, it is steeper at small than at large ). This corresponds to the graph in Option B.