AIEEE
Diffraction Questions
2 Diffraction questions from AIEEE with detailed answers and explanations. Free previous year questions and MCQs.
📚
2
Questions
🟢
0
Easy
🟡
2
Medium
🔴
0
Hard
Years:2026 (2)
Diffraction — AIEEE(1–2 of 2)
Filter:
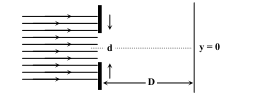
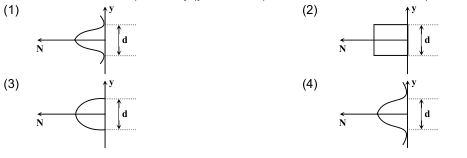
If is the intensity of the principal maximum in the single slit diffraction pattern, then what will be its intensity when the slit width is doubled?
AIEEE Diffraction — FAQ
How many Diffraction questions come in AIEEE?▼
Our database has 2 Diffraction questions from AIEEE covering 2026 to 2026.
What difficulty are AIEEE Diffraction questions?▼
The 2 AIEEE Diffraction questions include 0 easy, 2 medium and 0 hard level questions.
Where can I find more Diffraction questions for other exams?▼
Visit /tag/diffraction to see all Diffraction questions across all exams including Physics, General Studies, NEET 2019.