Competitive Exam
Pie Charts Questions
3 Pie Charts questions from Competitive Exam with detailed answers and explanations. Free previous year questions and MCQs.
📚
3
Questions
🟢
0
Easy
🟡
3
Medium
🔴
0
Hard
Years:2026 (3)
Pie Charts — Competitive Exam(1–3 of 3)
Filter:
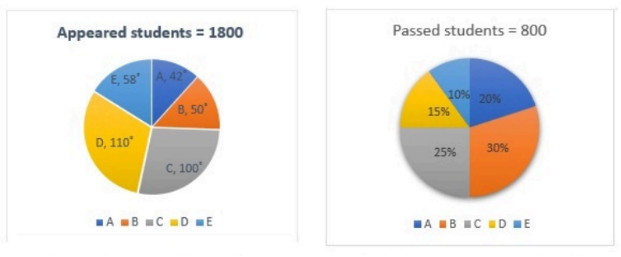
The pie chart shows the breakdown of students who appeared for the exam across different sections. Total appeared = 1000. Section A represents 20% and Section B represents 25%. Find the difference between the number of students who appeared for the exam in sections A and B.
In a distribution of students in a town, the total number of graduate students is and institute S comprises of them. The total number of post-graduate students is and institute S comprises of them. What is the ratio between the number of students studying at post-graduate and graduate levels respectively from institute S?
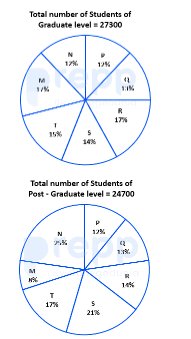
The data indicates the distribution of students across seven different institutes (P, Q, R, S, T, U, V). In a standard evaluation of this problem where the total number of graduate students is (with R comprising ) and post-graduate students is (with R comprising ), what is the total number of graduate and post-graduate level students in institute R?
Competitive Exam Pie Charts — FAQ
How many Pie Charts questions come in Competitive Exam?▼
Our database has 3 Pie Charts questions from Competitive Exam covering 2026 to 2026.
What difficulty are Competitive Exam Pie Charts questions?▼
The 3 Competitive Exam Pie Charts questions include 0 easy, 3 medium and 0 hard level questions.
Where can I find more Pie Charts questions for other exams?▼
Visit /tag/pie-charts to see all Pie Charts questions across all exams including Mathematics Mock Test - 11.