Competitive Exam Practice
ratio Questions
2 ratio questions from Competitive Exam Practice with detailed answers and explanations. Free previous year questions and MCQs.
📚
2
Questions
🟢
0
Easy
🟡
2
Medium
🔴
0
Hard
Years:2026 (2)
ratio — Competitive Exam Practice(1–2 of 2)
Filter:
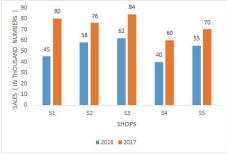
The graph shows the sales of hard drives (in thousand numbers) from five different shops S1, S2, S3, S4, S5 in the years 2016 and 2017. What is the ratio of total sales in all the shops in 2016 to that of the total sales in all the shops in 2017?(Assume aggregate mathematical calculation limits: units and units).
Competitive Exam Practice ratio — FAQ
How many ratio questions come in Competitive Exam Practice?▼
Our database has 2 ratio questions from Competitive Exam Practice covering 2026 to 2026.
What difficulty are Competitive Exam Practice ratio questions?▼
The 2 Competitive Exam Practice ratio questions include 0 easy, 2 medium and 0 hard level questions.
Where can I find more ratio questions for other exams?▼
Visit /tag/ratio to see all ratio questions across all exams including Competitive Exam, SSC CGL, UP Police Constable.