SSC CGL
Ratio Questions
4 Ratio questions from SSC CGL with detailed answers and explanations. Free previous year questions and MCQs.
📚
4
Questions
🟢
1
Easy
🟡
3
Medium
🔴
0
Hard
Years:2026 (4)
Ratio — SSC CGL(1–4 of 4)
Filter:
Study the following table, which shows the number of units of a product manufactured and sold by a company in five years, and answer the question.YearsNumber of units Manufactured (in thousands)Number of units Sold (in thousands)20133503202014375315201530028020164504232017420360The ratio of the total number of units sold in 2014 and 2015 to the number of units manufactured in 2017 is:
The following bar graph shows the number of students enrolled in Institutes A and B during 5 years (2014 to 2018).
Assume the values for 2017 are A=250,B=280; for 2018 are A=320,B=280; and for 2016, institute B=200.
What is the ratio of the total number of students enrolled in both the institutes during 2017 and 2018 to that of the number of students enrolled in institute B for the year 2016?
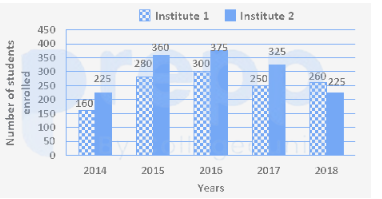
Assume the values for 2017 are A=250,B=280; for 2018 are A=320,B=280; and for 2016, institute B=200.
What is the ratio of the total number of students enrolled in both the institutes during 2017 and 2018 to that of the number of students enrolled in institute B for the year 2016?
Refer to the below data table and answer the following question.Weight (kg)Height in meterAnju Ankita Anupama Anuradha Who has the least weight to height ratio?
Refer to the below data table and answer the following question.
Division / Standard Boys Girls
Division A / Standard 5 20 30
Division B / Standard 5 15 20
Division C / Standard 5 30 10
Division A / Standard 6 30 25
Division B / Standard 6 30 25
Division C / Standard 6 30 20
What is the ratio of total boys to total girls?
Division / Standard Boys Girls
Division A / Standard 5 20 30
Division B / Standard 5 15 20
Division C / Standard 5 30 10
Division A / Standard 6 30 25
Division B / Standard 6 30 25
Division C / Standard 6 30 20
What is the ratio of total boys to total girls?
SSC CGL Ratio — FAQ
How many Ratio questions come in SSC CGL?▼
Our database has 4 Ratio questions from SSC CGL covering 2026 to 2026.
What difficulty are SSC CGL Ratio questions?▼
The 4 SSC CGL Ratio questions include 1 easy, 3 medium and 0 hard level questions.
Where can I find more Ratio questions for other exams?▼
Visit /tag/ratio to see all Ratio questions across all exams including Competitive Exam, UP Police Constable, Practice Test.