Competitive Exam Practice
averages Questions
3 averages questions from Competitive Exam Practice with detailed answers and explanations. Free previous year questions and MCQs.
📚
3
Questions
🟢
0
Easy
🟡
3
Medium
🔴
0
Hard
Years:2026 (3)
averages — Competitive Exam Practice(1–3 of 3)
Filter:
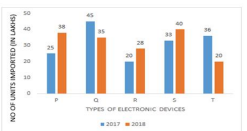
The given bar graph shows the total number of different types of electronic devices P, Q, R, S, T (in lakh) imported by the government of India in 2017 and 2018. Study the graph carefully and answer the following question.The average import of P and R types of electronic devices in 2018 was equal to the import of which type in 2017?
Rahul's average score across three exams is . In his fourth exam, he scores . What is Rahul's new average score across all four exams?
The average of 12 numbers is 47. The average of the first 5 numbers is 45 and the average of the next 4 numbers is 52. If the 10
th
number is 10 less than the 11
th
number and is 5 more than the 12
th
number, then what is the average value of the 11
th
and 12
th
numbers?
th
number is 10 less than the 11
th
number and is 5 more than the 12
th
number, then what is the average value of the 11
th
and 12
th
numbers?
Competitive Exam Practice averages — FAQ
How many averages questions come in Competitive Exam Practice?▼
Our database has 3 averages questions from Competitive Exam Practice covering 2026 to 2026.
What difficulty are Competitive Exam Practice averages questions?▼
The 3 Competitive Exam Practice averages questions include 0 easy, 3 medium and 0 hard level questions.
Where can I find more averages questions for other exams?▼
Visit /tag/averages to see all averages questions across all exams including Competitive Exam, SSC CGL, SSC Selection Post 2021 Matriculation Level.