SSC Selection Post 2021 Matriculation Level
Averages Questions
12 Averages questions from SSC Selection Post 2021 Matriculation Level with detailed answers and explanations. Free previous year questions and MCQs.
📚
12
Questions
🟢
6
Easy
🟡
4
Medium
🔴
2
Hard
Years:2026 (12)
Averages — SSC Selection Post 2021 Matriculation Level(1–12 of 12)
Filter:
The average weight of P, Q and R is . If the average weight of Q and R is and that of R and P is , then the average weight (in ) of P and Q is:
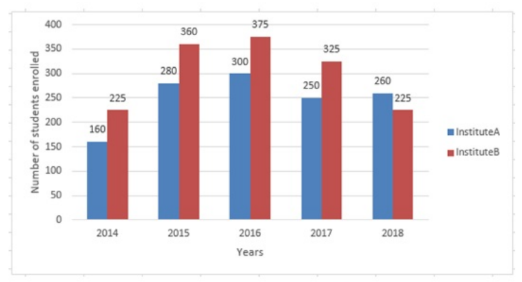
The given bar graph shows the number of students enrolled in institutes A and B during 5 years (2014 to 2018).What is the difference between the average number of students enrolled in institute B during the five years and the average number of students enrolled in institute A during the five years?
The average of numbers is . The average of the first numbers is and the average of the last numbers is . If the th number is excluded, what is the average of the remaining numbers (approximate to one decimal place)?
The average of the first three numbers out of four numbers is 18 and that of the last three numbers is 20. If the last number is 25, what is the first number?
What is the average of the first 8 multiples of 8?
The average of 15 numbers is 30, while the average of 13 of these numbers is 32. If the remaining two numbers are equal, then what is each of the two numbers?
The average weight of some persons in a club was . Seven persons with average weight joined the club and at the same time persons with average weight left the club. The average weight of all the persons in the group increased by . How many people were there initially in the club?
The average of 11 numbers is 25. If the average of 6 of these numbers is 24, then what is the average of the remaining 5 numbers?
The average weight of P and his four friends is . If P is lighter than the average weight of his four friends, then what is the weight of P (in )?
The average monthly salary of A, B, C and D is ₹. A gets ₹ more than B, B gets ₹ more than C, and C gets ₹ more than D. Find the monthly salary of A (in ₹).
The average score of 12 girls in a test is 16.5 and that of 8 boys in the same test is 16. Find the average score of girls and boys taken together.
Five years ago, the average age of a group of seven members was years. One member left the group just recently and the present average age of the group members became years. What is the present age (in years) of the member who left the group?
SSC Selection Post 2021 Matriculation Level Averages — FAQ
How many Averages questions come in SSC Selection Post 2021 Matriculation Level?▼
Our database has 12 Averages questions from SSC Selection Post 2021 Matriculation Level covering 2026 to 2026.
What difficulty are SSC Selection Post 2021 Matriculation Level Averages questions?▼
The 12 SSC Selection Post 2021 Matriculation Level Averages questions include 6 easy, 4 medium and 2 hard level questions.
Where can I find more Averages questions for other exams?▼
Visit /tag/averages to see all Averages questions across all exams including Competitive Exam, SSC CGL, Staff Selection Commission.