Competitive Exam
Profit and Loss Questions
248 Profit and Loss questions from Competitive Exam with detailed answers and explanations. Free previous year questions and MCQs.
📚
248
Questions
🟢
7
Easy
🟡
239
Medium
🔴
2
Hard
Years:2026 (248)
Profit and Loss — Competitive Exam(1–100 of 248)
Filter:
By selling a hair oil product for ₹336, the gain is 12%. If the gain is reduced to 9%, find the resultant selling price (in ₹).
A shopkeeper purchased groundnuts at ₹64/kg and sells at ₹80/kg. While selling, he uses faulty weights and gives 800 gm instead of 1 kg. Find his actual profit percentage.
A dealer sells an article at ₹850 after offering a cash discount of 15% on its marked price. Without discount, he would have earned a profit of 25%. What is the cost price of the article (in ₹)?
The three successive discounts of 18%, 12% and 10% is equivalent to a single discount of:
A merchant purchased 650kg of wheat at Rs. 50 per kg. He sold 250kg of it at a profit of 24% and 200kg at a loss of 24%. At what rate per kg (in Rs.) should he sell the remaining wheat to gain 20% on his initial investment?
A sold an article to B at 25% profit, B sold it to C at a 12% loss. If C paid Rs. 1,815 for the article, how much (in Rs.) did A pay for the article?
A customer paid Rs. 306 for an item after availing successive discounts of 10% and 15%. What is the marked price of the item (in Rs.)?
A sold an article to B at 10% loss, B sold it to C at 15% profit and C sold it to D at 10% profit. If D bought it for Rs. 4,554, then what was the cost price (in Rs.) of A?
After a price increase of 23%, a television set costs Rs. 56,703. What was its original price (in Rs.)?
On two items of equal prices, T gets 12% profit on one item and incurs 8% loss on other. What is his overall profit or loss percentage?
By selling a table for ₹, a trader gains . Find the cost price of the table.
A dishonest dealer professes to sell grains at cost price, but he uses a weight of 925g for 1kg weight. Find his gain percentage. (Approximate to two decimals.)
Sabiha purchased cups for her shop at ₹ each. During transportation, cups got damaged, and she sold the remaining cups at ₹ each. Find her overall percentage profit.
A 15% discount is allowed by a tradesman. How much above the cost price (in percentage) must he mark his goods so as to gain 19%?
The printed price of an article is higher than its cost price. Then, what is the rate of discount so that the gain is profit?
On an item there is 8% discount on the marked price of ₹32,000. After giving an additional season's discount, the item is sold for ₹25,000. How much is the season's discount (in %)? (Correct to two places of decimal)
To gain after allowing a discount of , by what percent must the marked price be hiked from the cost price?
A book vendor sold a book at a loss of . Had he sold it for more, he would have earned a profit of . Find out the cost of the book.
A multi-store outlet sold 1375 items in a week earning 25% gain. The total gain is also equal to the selling price of 'Q' number of items. What is the value of Q?
On selling an article for , a shopkeeper loses . To gain , at what price must he sell that article?
A person buys a table fan for Rs. 1,800 and sells it at a loss of 25%. What is the selling price of the table fan?
A shopkeeper allows a discount of on the marked price of an item but charges a sales tax of on the discounted price. If the customer pays as the price including the sales tax, then what is the marked price?
A person sold a horse at a gain of . Had he bought it for less and sold it for less, he would have made a profit of . The cost price of the horse was :
As a result of hike in the price of rice per kg, a person is unable to purchase more rice for . What was the original price of rice per kg?
A discount of 20% in the price of rice enables X to buy 5kg more rice for ₹ 100. What is the reduced price of rice per kg?
The cost price of 27 articles is same as the selling price of 18 articles. What is the profit percent?
An article was sold for ₹ 4,000. Had a discount of 10% was being offered, the profit would have been 20%. The cost price of the article was:
A dishonest dealer defrauds his seller and buyer by using forged weights to the extent of 20%. His true gain per cent is
If the cost price of tables is equal to the selling price of tables, then what is the loss percentage?
A fruit seller buys some oranges at the rate of for and an equal number more at for . Then he sells the whole lot at the rate of for . What is his loss or gain percentage?
What is the discount on a pair of shoes marked at and discounted at ?
Determine the list price of an item if a 20% discount on the item amounts to Rs. 50.
A shopkeeper offers a cash discount of ₹275 first and then three successive discounts of 10%, 8% and 5% on the sale of a laptop. If the marked price of the laptop is ₹85,275, find its price for a customer.
The ratio of the cost price of an article to its selling price is 432:612. The profit percentage (rounded off to 2 decimal places) on it is:
Sachin purchases a watch from a dealer at some price and sells it at 20% profit. The next day he purchases the same watch and marks up the price by 75% and offers a discount of 30%. What is the change in the percentage in the profit that Sachin receives on day 2?
A trader marks his goods at above the cost price and offers a discount of on the marked price. Find his profit percentage.
A wristwatch is sold for ₹2,700 at a loss of 10%. What is the cost price of the wristwatch?
Yusuf purchased an item for ₹5,500 and sold it at a profit of 15%. From that amount, he purchased another item and sold it at 12% profit. What is his overall gain?
A shopkeeper charges his customer 23% more than the cost price. If a customer paid ₹30,135 for a dining table, then find its original price (in ₹).
A shopkeeper buys chocolates for ₹ . To gain a profit, how many chocolates should he sell for ₹ ?
S.P. of articles is equal to C.P. of articles. Find the loss or profit percentage.
A man bought a horse and a carriage for Rs. . He sold the horse at a gain of and the carriage at a loss of . He gained on his whole transaction. What is the cost price of the horse?
A profit of is made by selling an article for . If the article were sold for , what would be the profit percentage?
If Punam, while selling two goats at the same price, makes a profit of on one goat and suffers a loss of on the other—
Successive discounts of and equal a single discount of:
If of S.P. is equal to of C.P. and if of S.P. is Rs. 2 more than of C.P., then find C.P. and S.P.:
Victoria purchased items that had a combined marked price of \ 400,000 10\% 5\% 2\% \ and paid the remaining balance via credit card, how much did she pay via credit card including surcharges?
An article is marked above the cost price. If a discount of is given on the marked price of the article, then a final profit of is obtained. Now if C.P. of a new article is and profit is desired then what should be the selling price of that new article?
Muskan buys two kg of pulses for ₹400 and sells it for ₹440. She also uses a weight of instead of (or ). What is Muskan’s actual profit percentage?
A merchant purchases a smartwatch for ₹1,800 and fixes its list price in such a way that, after allowing a discount of , he earns a profit of . The list price of the smartwatch (in ₹) is:
A piece of land was sold to a person through two middlemen, each gaining . If the person purchased the land for , the original cost (in ₹) of the land was:
A shopkeeper is incurring a loss of cost price of while selling to Ajay. If the shopkeeper had purchased at less price and had sold to Ajay at more than the selling price, then how much percentage would he have gained (rounded off to 1 decimal place)?
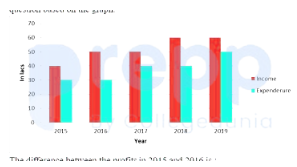
The following graph shows the income and expenditure of a company. Study the graph carefully and answer the question based on the graph.
[Note: In the standard reference data for this specific problem, the values are as follows:
For 2015: Income = Rs. 60 lacs, Expenditure = Rs. 40 lacs
For 2016: Income = Rs. 65 lacs, Expenditure = Rs. 30 lacs]
The difference between the profits in 2015 and 2016 is:
[Note: In the standard reference data for this specific problem, the values are as follows:
For 2015: Income = Rs. 60 lacs, Expenditure = Rs. 40 lacs
For 2016: Income = Rs. 65 lacs, Expenditure = Rs. 30 lacs]
The difference between the profits in 2015 and 2016 is:
A shopkeeper purchases supplies from a supplier. The supplier sells 750 units of bags to the shopkeeper after gaining the sale price of 125 units of bags. What is the gain percentage of the supplier?
A trader lists his articles 26% above the cost price and allows a discount of 15% on every article. What is his gain percentage?
A businessman marks up the price of his goods by 25% and gives a discount of 5% to the customer. He also uses a 950gm weight instead of a 1000gm weight. Find his overall profit percentage.
A man buys milk at ₹50 per litre and adds to it water equal to one-third of the milk. If he sells it at ₹60 per litre, then find his profit percentage.
If the selling price of a toy is
3
4
of its Cost Price, then the profit percentage is:
3
4
of its Cost Price, then the profit percentage is:
A man sells a cow for Rs. 22,000 and gains 10%. At what price should he sell the same cow, in order to gain 14%?
A shopkeeper sells goods at 82% loss on cost price but uses 28% less weight. What is his percentage profit or loss?
Shyam bought a chair for ₹1,563 and spent ₹350 on its repairing. He sold it for ₹2,398. Find his profit percentage (correct to two places of decimals).
The marked price of an item was ₹12,500. Two successive discounts of 12% each was offered on its sale. What was the selling price (in ₹) of the item?
A chair is bought for ₹600 and sold for ₹750. Find the profit percentage.
A shopkeeper bought a sofa-set, a centre table and a dining table for ₹15,000, ₹3,000 and ₹7,000, respectively. He sold the sofa-set at 20% profit and the centre table at 15% profit. At what profit percentage should he sell the dining table to earn 18% on the whole transaction?
The difference between the cost price and the selling price of a table lamp is ₹540. If the profit is 30%, then the selling price (in ₹) is:
A reduction of in the price of rice enables a customer to purchase more for . What is the original price of rice per kg?
Suraj bought 90 articles at ₹12.50 per article. He sold 60% of them at ₹15 per article and 50% of the remaining at ₹10.50 per article. At what price (in ₹) per article should he sell the remaining articles to get 20% profit in the entire transaction?
The marked price of a commodity was given as ₹425 per kg. After two successive discounts of 5% and y%, respectively, the retailer purchased it for ₹323 per kg. What was the value of y?
A shopkeeper sold sarees at ₹529 each after giving an 8% discount on their marked price. Had he not given the discount, he would have earned a profit of 15% on their cost. What was the cost price (in ₹) of each saree?
After selling books for , a shopkeeper says that he incurs a loss equal to the C.P. of books. Find the C.P. of a book.
In what ratio must the two types of tea at and respectively be mixed so that the obtained mixture sold at earns a profit of ?
A shopkeeper sold 6 shirts of company A for ₹4,290 at 10% profit and 8 shirts of company B for ₹6,156 at 14% profit. What was his profit percentage (correct to 2 decimal places)?
If a shopkeeper gives two successive discounts of 50% and 20% on a mattress, whose marked price is ₹72,580, what would be its selling price (in ₹) and the discount (in ₹), respectively?
The list price of an article is ₹ 80. A customer pays ₹ 30 for it. He was given 2 successive discounts, one of them being 50%. What was the other discount?
Anju sold an article to her friend Rakesh at 14% loss. If Rakesh sold it for ₹2,537 and made a profit of 18%, then the original cost price (in ₹) of the article for Anju was:
A cloth piece was purchased for ₹ 700. At what price should it be sold to get a profit of 12.5% after a tailoring charge of ₹ 20 was paid for?
By selling 80 notebooks, Amrita loses an amount equal to the selling price of 10 notebooks. What is her loss per cent (to the nearest integer)?
If the selling price is tripled, the profit becomes 5 times. What is the profit percent?
A manufacturer undertakes to supply pieces of a particular component at per piece. According to his estimates, even if components fail to pass the quality test, then he will make a profit of . However, as it turned out, of the components were rejected. Then what is the loss to the manufacturer?
The list price of an article was ₹735. Ravi sold it after giving a 20% discount on its list price and still made a profit of 47%. What was the cost price (in ₹) of the article?
A bought an item for ₹1,100 and sold it to B at a loss of 5%. B sold the item to C at a profit of k% for ₹1,254. Find the value of k.
A shopkeeper bought pencils at each and sold them at each. Calculate the total profit or loss.
A toy is sold for ₹ after giving two successive discounts, each of . If the marked price of the article is ₹, then what is the value of ?
An article was sold for at a loss of . Find the cost price of the article.
A shopkeeper bought dozen eggs at ₹ per egg. eggs broke in transportation. He sold the remaining eggs at ₹ each. What is his profit or loss per cent?
Rajesh made a profit of 14% when he sold a raincoat for ₹7,980. Find the cost price of the raincoat.
A man sold an article for Rs. 644 gaining
3
1
rd of his outlay. Find the cost price of the article.
3
1
rd of his outlay. Find the cost price of the article.
A second-hand car was sold at a profit of . Had it been sold for ₹ less, the profit would have been . What is the cost price (in ₹, to the nearest integer) of the car?
Sarika bought three shirts for her husband and paid Rs. 4,200 for all the three pieces. The shopkeeper gave her a discount of 20% on the total amount. What would be the marked price of one shirt?
A trader marked the price of a commodity to include a profit of but allowed a discount of on the marked price. What will be his actual profit?
A shopkeeper allows a rebate of on the marked price of an article such that the selling price is . Then the marked price of the article is:
By selling a car for , Mr. Rao lost . Then the cost price of the car is:
An article marked for ₹30,000 is available through two discount schemes. Under scheme 1, successive discounts of 25%, 16% and 15% are offered. Under scheme 2, successive discounts of 20%, 15% and 16% are offered. Find the difference between the selling price under the two schemes.
A store announces a discount of and then allows another discount of . What is the final sale price (in ₹, to the nearest integer) of a bed whose marked price is ₹?
Shatish sold a music system to Karan at a 25% gain and Karan sold it to Swati at a 30% gain. If Swati paid Rs. 12,500 for the music system, what amount did Shatish pay for the same?
A salesman purchases goods at ₹1,250 and is forced to sell it at ₹1,000. Find his loss percentage.
A man buys oranges at for ₹ and sells them at for ₹. How many oranges must he sell to gain ₹?
A shopkeeper expects a gain of 36% on his cost price. If in a month, his sale was ₹6,14,856, then what was his profit (in ₹)?
If the cost price of a table is ₹400 and the selling price is ₹600, then find the profit percentage.
Competitive Exam Profit and Loss — FAQ
How many Profit and Loss questions come in Competitive Exam?▼
Our database has 248 Profit and Loss questions from Competitive Exam covering 2026 to 2026.
What difficulty are Competitive Exam Profit and Loss questions?▼
The 248 Competitive Exam Profit and Loss questions include 7 easy, 239 medium and 2 hard level questions.
Where can I find more Profit and Loss questions for other exams?▼
Visit /tag/profit-and-loss to see all Profit and Loss questions across all exams including SSC CGL, Staff Selection Commission, Practice Test.