Staff Selection Commission
Data Interpretation Questions
25 Data Interpretation questions from Staff Selection Commission with detailed answers and explanations. Free previous year questions and MCQs.
📚
25
Questions
🟢
5
Easy
🟡
20
Medium
🔴
0
Hard
Years:2026 (25)
Data Interpretation — Staff Selection Commission(1–25 of 25)
Filter:
Refer to the below data table and answer the following question:
Number of employees Annual salary (in lakhs) Bonus as percent of annual salary
Manager: 2 48 50%
Executive: 12 8 30%
Trainee: 14 1 10%
What is the average bonus per employee (in rupees)?
Number of employees Annual salary (in lakhs) Bonus as percent of annual salary
Manager: 2 48 50%
Executive: 12 8 30%
Trainee: 14 1 10%
What is the average bonus per employee (in rupees)?
Refer to the below data table and answer the following question:
India's exports in 2015 Value in million US$
Jewellery 750
Software 950
Cotton 775
Steel 525
Electronics 700
Cotton was what percent of total exports?
India's exports in 2015 Value in million US$
Jewellery 750
Software 950
Cotton 775
Steel 525
Electronics 700
Cotton was what percent of total exports?
Refer to the below data table and answer the following question:
Refer to the below data table and answer the following question:
Company 2011 2012 2013 2014 2015
Company A 1000 2000 4000 4000 5000
Company B 4000 4000 1000 2000 1000
Company C 3000 3000 1000 2000 1000
For which of the following pairs of years are the total exports from the three companies together equal?
(Note: Figures given are in lakh rupees)
Company 2011 2012 2013 2014 2015
Company A 1000 2000 4000 4000 5000
Company B 4000 4000 1000 2000 1000
Company C 3000 3000 1000 2000 1000
For which of the following pairs of years are the total exports from the three companies together equal?
(Note: Figures given are in lakh rupees)
Refer to the below data table and answer the following question.
Partners Present % share
Anand 5
Basu 10
Chinmay 30
Dhiraj 5
Ejaz 50
If the company has issued six lakh (600,000) shares between its five partners and if Basu offers to sell 15,000 of his shares to Ejaz, then Ejaz will have how many shares?
Partners Present % share
Anand 5
Basu 10
Chinmay 30
Dhiraj 5
Ejaz 50
If the company has issued six lakh (600,000) shares between its five partners and if Basu offers to sell 15,000 of his shares to Ejaz, then Ejaz will have how many shares?
Refer to the below data table and answer the following question.
Partner Weight (kg) Height (meter)
Anita 56 1.71
Anjali 64 1.52
Anjalika 51 1.72
Anjana 52 1.59
Who has the least weight to height ratio?
Partner Weight (kg) Height (meter)
Anita 56 1.71
Anjali 64 1.52
Anjalika 51 1.72
Anjana 52 1.59
Who has the least weight to height ratio?
Refer to the below data table and answer the following question.PartnersPresent % shareAnand10Basu5Chinmay30Dhiraj5Ejaz50If the company has issued six lakh () shares between its five partners and if Chinmay offers to sell of his shares to Dhiraj, then Dhiraj will have how many shares in total?
The following table shows the number of children in each house of a society.Number of Children (xi)Number of Houses (fi)0411321735What is the average number of children per house?
Refer to the below data table and answer the following question.YearCompany's % Profit20112520125201310201415201520What was the Revenue of the company if its Expenditure was in the year when its profit was the least?
Refer to the below data table and answer the following question.NameWeight (kg)Height (meter)Aruna791.61Arushi521.68Arya521.50Asha531.63Who has the least weight to height ratio?
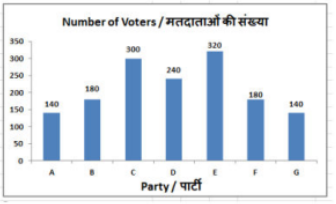
Comprehension:The following detailed list shows the results of a survey where people exiting voting booths were asked for which party they voted:Party A: votesParty B: votesParty C: votesParty D: votesParty E: votesParty F: votesParty G: votesWhat is the ratio of voters of party D to voters of party G?
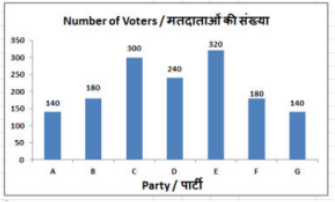
Comprehension:The following detailed list shows the results of a survey where people exiting voting booths were asked for which party they voted:Party A: votesParty B: votesParty C: votesParty D: votesParty E: votesParty F: votesParty G: votesIf of voters of party C had voted for party B instead, then party B's voters would have increased by _______.
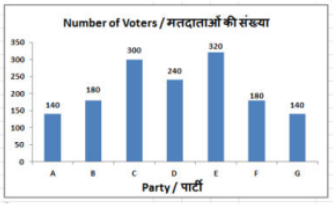
Comprehension:The following detailed list shows the results of a survey where people exiting voting booths were asked for which party they voted:Party A: votesParty B: votesParty C: votesParty D: votesParty E: votesParty F: votesParty G: votesNumber of voters of party A were lesser than that of party C by _______.
The following table shows the expenditure of a school (in ₹ lakh) per annum on different heads over the given years.
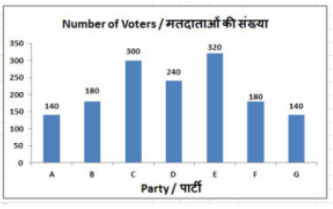
Comprehension:The following detailed list shows the results of a survey where people exiting voting booths were asked for which party they voted:Party A: votesParty B: votesParty C: votesParty D: votesParty E: votesParty F: votesParty G: votesWhich party had the second highest number of voters?
The line graph shows the number of vacancies for accountants in a certain company. The data points show that there are 35 vacancies in 2014.
If the salary of an accountant in the company is Rs 40,000 per month, then what was the increase in the expense (in Rs lakhs) due to salaries that had to be paid annually when posts were filled for the vacancies in the year 2014?
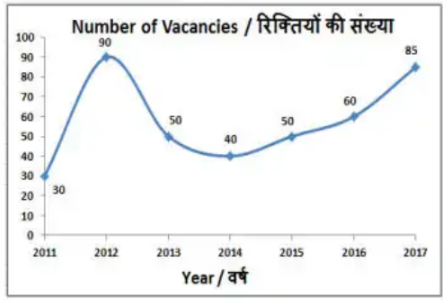
If the salary of an accountant in the company is Rs 40,000 per month, then what was the increase in the expense (in Rs lakhs) due to salaries that had to be paid annually when posts were filled for the vacancies in the year 2014?
The line graph shows the number of vacancies for accountants in a certain company. The data points are: 2011: 40, 2012: 60, 2013: 30, 2014: 10, 2015: 50, 2016: 40, 2017: 70.
The number of vacancies in 2014 were lesser than that in 2015 by:
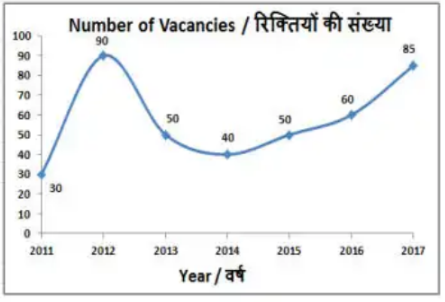
The number of vacancies in 2014 were lesser than that in 2015 by:
The line graph shows the number of vacancies for accountants in a certain company. The data points are: 2011: 40, 2012: 60, 2013: 30, 2014: 10, 2015: 50, 2016: 40, 2017: 70.
What was the difference in the number of vacancies between the years 2012 and 2014?
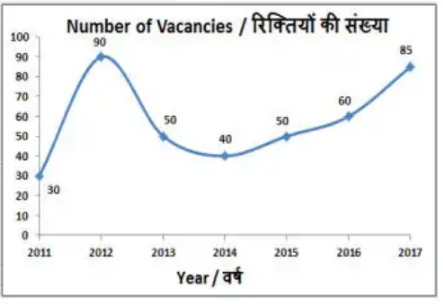
What was the difference in the number of vacancies between the years 2012 and 2014?
The line graph shows the number of vacancies for accountants in a certain company from 2011 to 2017. The corresponding vacancy data points are: 2011: 40, 2012: 60, 2013: 30, 2014: 10, 2015: 50, 2016: 40, 2017: 70.
In which year were the number of vacancies lesser than that of the previous year?
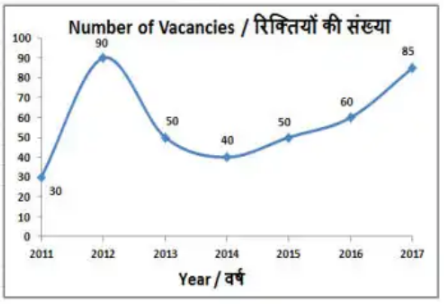
In which year were the number of vacancies lesser than that of the previous year?
Refer to the data table below and answer the following question.
India's exports in 2015
Category Value in million US$
Jewellery 825
Software 750
Cotton 875
Steel 875
Electronics 975
Jewellery was what percent of total exports?
India's exports in 2015
Category Value in million US$
Jewellery 825
Software 750
Cotton 875
Steel 875
Electronics 975
Jewellery was what percent of total exports?
Refer to the data table below and answer the following question.
Refer to the data table below and answer the following question.
(Note: Figures given are in lakh rupees)
Company 2011 2012 2013 2014 2015
Company A 2000 2000 5000 2000 1000
Company B 2000 3000 1000 5000 2000
Company C 3000 2000 5000 3000 3000
For which of the following pairs of years are the total exports from the three Companies together equal?
(Note: Figures given are in lakh rupees)
Company 2011 2012 2013 2014 2015
Company A 2000 2000 5000 2000 1000
Company B 2000 3000 1000 5000 2000
Company C 3000 2000 5000 3000 3000
For which of the following pairs of years are the total exports from the three Companies together equal?
Refer to the data table below and answer the following question.
Number of employees Annual salary (in lakhs) Bonus as percent of annual salary
Manager 3 36
Executive 4 12
Trainee 3 4
What is the average bonus (in rupees) per employee?
Number of employees Annual salary (in lakhs) Bonus as percent of annual salary
Manager 3 36
Executive 4 12
Trainee 3 4
What is the average bonus (in rupees) per employee?
The following table shows the % of marks obtained by three students in three different subjects in a school exam. (The maximum marks in each subject are shown in the table at the top)
Student English (120) Science (150) Mathematics (200)
Yogesh 81 67 52
Varun 64 70 63
Seema 70 56 72
Find the total marks obtained by Varun and Seema together in Science.
Student English (120) Science (150) Mathematics (200)
Yogesh 81 67 52
Varun 64 70 63
Seema 70 56 72
Find the total marks obtained by Varun and Seema together in Science.
Staff Selection Commission Data Interpretation — FAQ
How many Data Interpretation questions come in Staff Selection Commission?▼
Our database has 25 Data Interpretation questions from Staff Selection Commission covering 2026 to 2026.
What difficulty are Staff Selection Commission Data Interpretation questions?▼
The 25 Staff Selection Commission Data Interpretation questions include 5 easy, 20 medium and 0 hard level questions.
Where can I find more Data Interpretation questions for other exams?▼
Visit /tag/data-interpretation to see all Data Interpretation questions across all exams including SSC CGL, Competitive Exam, Prepp.