SSC CGL
Data Interpretation Questions
91 Data Interpretation questions from SSC CGL with detailed answers and explanations. Free previous year questions and MCQs.
📚
91
Questions
🟢
8
Easy
🟡
82
Medium
🔴
1
Hard
Years:2026 (91)
Data Interpretation — SSC CGL(1–91 of 91)
Filter:
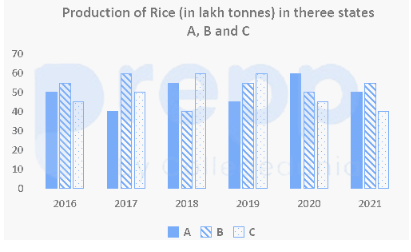
In a data analysis from 2016 to 2021, the production values of rice recorded for each year show a clear pattern. If the recorded peak is observed at the end of this range in the final year, during 2016 to 2021, for which year is the production of rice highest?
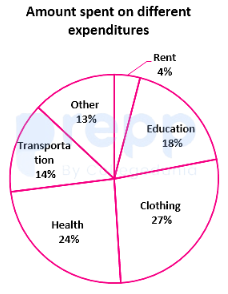
The following question refers to the distribution of expenditures incurred by Rohan under different heads. Rohan has a monthly income of ₹50,000 out of which he spends 60% on different expenditures. What is the total expenditure (in ₹) incurred on Health, Education and Transportation together if they comprise 14%, 25%, and 17% of the total spent amount respectively?
Refer the below data table and answer the following Question.
Items
Raw Materials
Labour
Rent
Interest
Taxes
Yearly Expense in Rs lakhs
12
6
6
4
4
Labour and Interest are what percent of total expenses?
Items
Raw Materials
Labour
Rent
Interest
Taxes
Yearly Expense in Rs lakhs
12
6
6
4
4
Labour and Interest are what percent of total expenses?
Refer the below data table and answer the following Question.
Day of the week
Monday
Tuesday
Wednesday
Thursday
Friday
Saturday
Sunday
Distance jogged (in kms)
3.5
2
3
0.5
3.5
2.5
3.5
If 400 calories are burned by jogging 5 km, how many calories were burnt in the given week?
Day of the week
Monday
Tuesday
Wednesday
Thursday
Friday
Saturday
Sunday
Distance jogged (in kms)
3.5
2
3
0.5
3.5
2.5
3.5
If 400 calories are burned by jogging 5 km, how many calories were burnt in the given week?
Refer the below data table and answer the following Question.
Month
January
February
March
April
May
June
Cumulative production
200
850
1450
1950
2320
2600
How many cars were manufactured in the months of April and May?
Month
January
February
March
April
May
June
Cumulative production
200
850
1450
1950
2320
2600
How many cars were manufactured in the months of April and May?
Refer the below data table and answer the following Question.
Medical
Engineering
Boys
40
100
Girls
75
25
What percent students who chose Engineering are girls?
Medical
Engineering
Boys
40
100
Girls
75
25
What percent students who chose Engineering are girls?
Refer to the below data table and answer the following question.
Study the given table and answer the question that follows.
The table shows the production (in thousands) of four different types of tractors by a company during five years.
Year/Tractor Type
2010
2011
2012
2013
2014
Type - A
18
15
23
17
14
Type - B
25
24
13
23
26
Type - C
12
14
17
12
20
Type - D
19
10
13
11
18
Which type of tractor has same production in the years 2010 and 2013?
The following table shows the marks (out of 100) obtained by four students in five different subjects.
Student/Subject English Hindi Maths Science Social Science
Riya 88 94 90 95 93
Charu 91 93 88 92 88
Preeti 89 95 91 97 95
Mohan 90 88 95 96 89
How many marks did Preeti score in Science?
Student/Subject English Hindi Maths Science Social Science
Riya 88 94 90 95 93
Charu 91 93 88 92 88
Preeti 89 95 91 97 95
Mohan 90 88 95 96 89
How many marks did Preeti score in Science?
Refer to the below data table and answer the following question.
Subjects Marks scored
English 70
Hindi 40
Math 75
Science 35
Arts 70
Five points are to be deducted from this student's average of marks scored because of poor attendance. What will be this student's net average marks scored?
Subjects Marks scored
English 70
Hindi 40
Math 75
Science 35
Arts 70
Five points are to be deducted from this student's average of marks scored because of poor attendance. What will be this student's net average marks scored?
Refer to the below data table and answer the following question.
Marks Number of students
40 and above 25
30 and above 49
20 and above 78
10 and above 99
0 and above 118
How many students have scored marks 20 or more but less than 40?
Marks Number of students
40 and above 25
30 and above 49
20 and above 78
10 and above 99
0 and above 118
How many students have scored marks 20 or more but less than 40?
Refer to the below data table and answer the following question.
Division / Standard Boys Girls
Division A / Standard 5 15 15
Division B / Standard 5 35 40
Division C / Standard 5 30 15
Division A / Standard 6 10 25
Division B / Standard 6 20 40
Division C / Standard 6 30 30
What is the overall ratio of boys to girls across all divisions and standards?
Division / Standard Boys Girls
Division A / Standard 5 15 15
Division B / Standard 5 35 40
Division C / Standard 5 30 15
Division A / Standard 6 10 25
Division B / Standard 6 20 40
Division C / Standard 6 30 30
What is the overall ratio of boys to girls across all divisions and standards?
The following table shows the number of children in each house of a society.
Number of Children Number of Houses
0 3
1 9
2 18
3 3
What is the average number of children per house?
Number of Children Number of Houses
0 3
1 9
2 18
3 3
What is the average number of children per house?
Refer the below data table and answer the following Question.
Partners Present % share
Anand 20
Basu 20
Chinmay 10
Dhiraj 30
Ejaz 20
If the company has issued six lakh (6,000,000) shares between its five partners and if Basu offers to sell 15,000 of his shares to Dhiraj, then Dhiraj will have how many shares?
Partners Present % share
Anand 20
Basu 20
Chinmay 10
Dhiraj 30
Ejaz 20
If the company has issued six lakh (6,000,000) shares between its five partners and if Basu offers to sell 15,000 of his shares to Dhiraj, then Dhiraj will have how many shares?
Refer the below data table and answer the following Question.
Refer the below data table and answer the following Question.
Weight (kg) Height in meter
Aditi 56
Advika 64
Aesha 51
Agrima 52
Who has the least weight to height ratio?
Weight (kg) Height in meter
Aditi 56
Advika 64
Aesha 51
Agrima 52
Who has the least weight to height ratio?
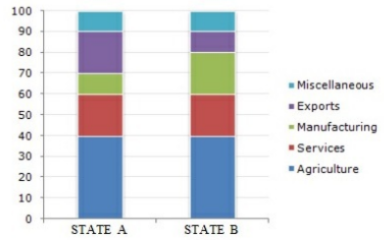
Study the given bar-graph and answer the question that follows.
The bar-graph shows the percentage revenue allocation by two states in various sectors.
(Note: Based on standard exam datasets, the percentage allocation for State A in Exports is 35% and in Manufacturing is 25%)
If the amount of money allocated to the two states is ₹20 billion each, then how much more (in rupees) does State A spend on Exports than on Manufacturing?
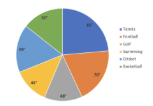
The given pie-chart shows the expenditure (in ₹ lakh) of a country on various sports during a particular year. Study the chart carefully and answer the question that follows.
(Note: Based on standard exam datasets, let the relative expenditure proportions be: Golf = 12.5%, Swimming = 10%, Football = 22.5%, Cricket = 25%)
The average expenditure on golf and swimming is what per cent (rounded to 1 decimal place) more or less than the average expenditure on football and cricket?
Refer the below data table and answer the following Question.Weight (kg)Height (m)Aarti68Aarohi55Aarushi71Aasha59Who has the least weight to height ratio?
Refer to the data table below and answer the following question.YearCompany's % Profit20112520122520135201425201510What was the Revenue of the company if its Expenditure was Rs 350 crore in the year when its % profit was the least?
Refer the below data table and answer the following Question.YearCompany's % Profit201125201225201310201420201520What was the Revenue of the company if its Expenditure was in the year when its % profit was the least?
Refer the below data table and answer the following Question.PartnersPresent % shareAnand15Basu15Chinmay15Dhiraj20Ejaz35If the company has issued shares between its five partners and if Basu offers to sell of his shares to Ejaz, then Ejaz will have how many shares?
Refer to the data table below and answer the following question.Weight (kg)Height in metersName601.80Ahilya701.70Aishwarya631.68Akanksha671.76AlishaWho has the least weight to height ratio?
The following table shows the number of children in each house of a society.Number of Children (x)Number of Houses (f)0311021233What is the average number of children per house?
Refer to the data table below and answer the following question.PartnersPresent % shareAnand15Basu10Chinmay15Dhiraj10Ejaz50If the company has issued six lakh (6,00,000) shares among its five partners and if Chinmay offers to sell 15,000 of his shares to Dhiraj, then Dhiraj will have how many shares in total?
Comprehension:
The profits (in Rs lakhs) of a certain company over the years are as follows:
2011: 20
2012: 40
2013: 30
2014: 65
2015: 50
2016: 30
In which year were the profits greater than that of the previous year?
The profits (in Rs lakhs) of a certain company over the years are as follows:
2011: 20
2012: 40
2013: 30
2014: 65
2015: 50
2016: 30
In which year were the profits greater than that of the previous year?
Comprehension:
The profits (in Rs lakhs) of a certain company over the years are as follows:
2011: 20
2012: 40
2013: 30
2014: 65
2015: 50
2016: 30
What was the difference in the profits (in Rs lakhs) between the years 2014 and 2013?
The profits (in Rs lakhs) of a certain company over the years are as follows:
2011: 20
2012: 40
2013: 30
2014: 65
2015: 50
2016: 30
What was the difference in the profits (in Rs lakhs) between the years 2014 and 2013?
Comprehension:
The profits (in Rs lakhs) of a certain company over the years are as follows:
2011: 20
2012: 40
2013: 30
2014: 65
2015: 50
2016: 30
The profits in 2012 were greater than that in 2016 by ________
The profits (in Rs lakhs) of a certain company over the years are as follows:
2011: 20
2012: 40
2013: 30
2014: 65
2015: 50
2016: 30
The profits in 2012 were greater than that in 2016 by ________
Comprehension:
The profits (in Rs lakhs) of a certain company over the years are as follows:
2011: 20
2012: 40
2013: 30
2014: 65
2015: 50
2016: 30
What were the total profits (in Rs lakhs) of the company in the last four years?
The profits (in Rs lakhs) of a certain company over the years are as follows:
2011: 20
2012: 40
2013: 30
2014: 65
2015: 50
2016: 30
What were the total profits (in Rs lakhs) of the company in the last four years?
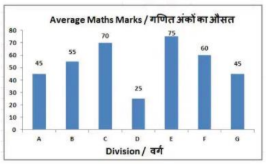
The bar graph shows average marks scored in a 100 marks exam by students of 7 divisions of Standard X. Study the diagram and answer the following question.If all students of Division D got a bonus of 5 marks each, their new average marks would increase by how much percentage?

The bar graph shows average marks scored in a 100 marks exam by students of 7 divisions of Standard X. Study the diagram and answer the following question.Average marks of division C were lesser than that of division E by:
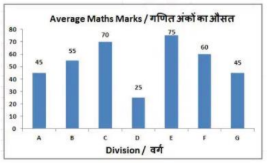
The bar graph shows average marks scored in a 100 marks exam by students of 7 divisions of Standard X. Study the diagram and answer the following question.What is the ratio of average marks scored by Division E to Division B?
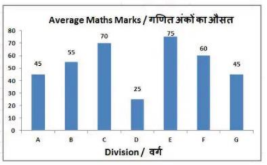
The bar graph shows average marks scored in a 100 marks exam by students of 7 divisions of Standard X. Study the diagram and answer the following question.Which division scored the second highest marks?
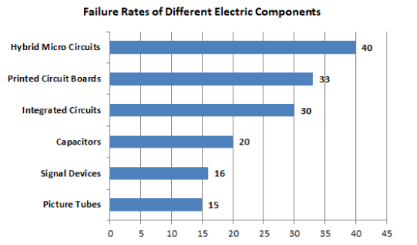
The following bar graph shows the failure rates (in thousands) for different electric components:How many times is the failure rate of hybrid micro circuits compared to that of signal devices?
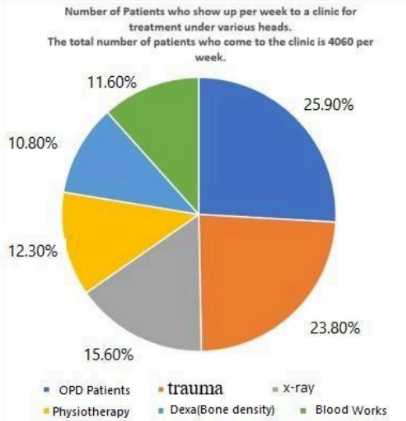
The given pie chart displays the number of patients who come to a clinic per week, for treatment under various heads. The total number of patients who come to the clinic is per week. Study the pie chart and answer the question that follows.(Note: Since percentages/degrees values are typically proportional, we can compute directly using their standard standard values for this question where Trauma + Dexa + Blood works = and OPD + X-ray + Physiotherapy = , or equivalent values leading to the exact percentage)The combined number of patients for the treatment of trauma, dexa and blood works is what percentage (rounded off to 1 decimal place) more or less than the combined number of patients for OPD, X-ray and physiotherapy?
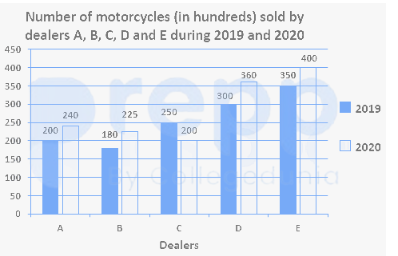
Study the given graph and answer the question that follows.
The percentage increase in the sale of motorcycles in 2020 as compared to that in 2019 is below 15% for the dealer:
(Note: Standard data for this typical CGL graph problem indicates values for dealers A, B, C, D, E in 2019 and 2020)
The percentage increase in the sale of motorcycles in 2020 as compared to that in 2019 is below 15% for the dealer:
(Note: Standard data for this typical CGL graph problem indicates values for dealers A, B, C, D, E in 2019 and 2020)
The following table shows the number of medals won by four boys in different activities.Name of Boy / ActivityYogaSwimmingDanceSingingRamagya24283233Bitthal28302928Rameshwar35293830Krishna29343136Who won more medals in swimming than in singing?
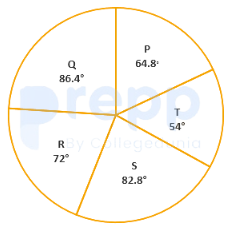
Study the given pie chart and answer the question that follows.
The pie chart shows the distribution (degree-wise) of the students who appeared in the annual examination from institute P, Q, R, S and T in 2020. The total number of students who appeared is 3000.
The average number of students who appeared in the examination from the institute Q, S and T exceeds the number of students who appeared from institute R by x. The value of x lies between:
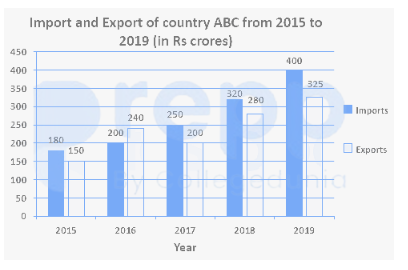
Study the given graph and answer the question that follows.
The average exports of country ABC in 2015, 2017 and 2018 are what percentage of the total imports from 2015 to 2018 (correct to one decimal place)?
The average exports of country ABC in 2015, 2017 and 2018 are what percentage of the total imports from 2015 to 2018 (correct to one decimal place)?
Refer the below data table and answer the following Question.
Designation Number of employees Annual salary (in lakhs) Bonus as percent of annual salary
Manager 3 30 30%
Executive 8 16 20%
Trainee 4 2 20%
What is the average bonus (in rupees)?
Designation Number of employees Annual salary (in lakhs) Bonus as percent of annual salary
Manager 3 30 30%
Executive 8 16 20%
Trainee 4 2 20%
What is the average bonus (in rupees)?
Refer to the below data table and answer the following question.
Number of employees Annual salary (in lakhs) Bonus as percent of annual salary
Manager
3
5 40%
Executive
5
1.2 30%
Trainee
5
0.2 20%
What is the average bonus (in rupees)?
Number of employees Annual salary (in lakhs) Bonus as percent of annual salary
Manager
3
5 40%
Executive
5
1.2 30%
Trainee
5
0.2 20%
What is the average bonus (in rupees)?
Refer to the below data table and answer the following question.
2011 2012 2013 2014 2015
Company A 1000 4000 5000 5000 5000
Company B 3000 5000 2000 5000 3000
Company C 1000 4000 4000 1000 1000
For which of the following pairs of years the total exports from the three Companies together are equal?
(Note: Figures given are in lakh rupees)
2011 2012 2013 2014 2015
Company A 1000 4000 5000 5000 5000
Company B 3000 5000 2000 5000 3000
Company C 1000 4000 4000 1000 1000
For which of the following pairs of years the total exports from the three Companies together are equal?
(Note: Figures given are in lakh rupees)
Study the following table, (which shows the number of units of an item manufactured and sold by companies) and answer the question.CompanyNo. of units Manufactured (in thousands)Sold (in thousands)A4230B4532C3626D5136E5440Which Company sold the highest percentage of units as compared to manufactured by it?
Refer to the below data table and answer the following question.
India's exports in 2015
Value in million US$
Jewellery 600
Software 675
Cotton 800
Steel 775
Electronics 525
Software was what percent of total exports?
India's exports in 2015
Value in million US$
Jewellery 600
Software 675
Cotton 800
Steel 775
Electronics 525
Software was what percent of total exports?
The following table shows the percentage of marks obtained by five students in four subjects in an examination.
Student/Subject Maths Physics Chemistry Computer Science
A 90% 65% 76% 64%
B 67% 93% 55% 56%
C 85% 61% 70% 80%
D 59% 75% 84% 91%
E 94% 48% 99% 99%
How many students scored more than 60% of marks in all the four subjects?
Student/Subject Maths Physics Chemistry Computer Science
A 90% 65% 76% 64%
B 67% 93% 55% 56%
C 85% 61% 70% 80%
D 59% 75% 84% 91%
E 94% 48% 99% 99%
How many students scored more than 60% of marks in all the four subjects?
The following table shows the number of eggs produced by five farms A, B, C, D and E over the given years.
Refer to the below data table and answer the following question:
Subjects Marks scored
English 70
Hindi 75
Math 30
Science 75
Arts 60
Five points are to be deducted from this student's average of marks scored because of poor attendance. What will be this student's net average marks scored?
Subjects Marks scored
English 70
Hindi 75
Math 30
Science 75
Arts 60
Five points are to be deducted from this student's average of marks scored because of poor attendance. What will be this student's net average marks scored?
Refer to the below data table and answer the following question.
Refer to the below data table and answer the following question.
Division / Standard Boys Girls
Division A / Standard 5 20 30
Division B / Standard 5 15 20
Division C / Standard 5 30 10
Division A / Standard 6 30 25
Division B / Standard 6 30 25
Division C / Standard 6 30 20
What is the ratio of total boys to total girls?
Division / Standard Boys Girls
Division A / Standard 5 20 30
Division B / Standard 5 15 20
Division C / Standard 5 30 10
Division A / Standard 6 30 25
Division B / Standard 6 30 25
Division C / Standard 6 30 20
What is the ratio of total boys to total girls?
Refer the below data table and answer the following Question.
Company 2011 2012 2013 2014 2015
Company A 3000 5000 4000 5000 5000
Company B 1000 1000 1000 2000 2000
Company C 4000 2000 2000 2000 3000
For which of the following pairs of years the total exports from the three Companies together are equal?
(Note: Figures given are in lakh rupees)
Company 2011 2012 2013 2014 2015
Company A 3000 5000 4000 5000 5000
Company B 1000 1000 1000 2000 2000
Company C 4000 2000 2000 2000 3000
For which of the following pairs of years the total exports from the three Companies together are equal?
(Note: Figures given are in lakh rupees)
Refer the below data table and answer the following Question.
India's exports in 2015
Category Value in million US$
Jewellery 675
Software 500
Cotton 525
Steel 575
Electronics 725
Jewellery was what percent of total exports?
India's exports in 2015
Category Value in million US$
Jewellery 675
Software 500
Cotton 525
Steel 575
Electronics 725
Jewellery was what percent of total exports?
Study the following table, which shows the number of units of a product manufactured and sold by a company in five years, and answer the question.YearsNumber of units Manufactured (in thousands)Number of units Sold (in thousands)20133503202014375315201530028020164504232017420360In which year the number of units of the product sold is less than the average number of units manufactured per year?
Study the following table, which shows the number of units of a product manufactured and sold by a company in five years, and answer the question.YearsNumber of units Manufactured (in thousands)Number of units Sold (in thousands)20133503202014375315201530028020164504232017420360The ratio of the total number of units sold in 2014 and 2015 to the number of units manufactured in 2017 is:
Study the following table, which shows the number of units of a product manufactured and sold by a company in five years, and answer the question.YearsNumber of units Manufactured (in thousands)Number of units Sold (in thousands)20133503202014375315201530028020164504232017420360What percent of total units of the product manufactured in 2013 and 2015 is the total units unsold during the five years? (correct to one decimal place)
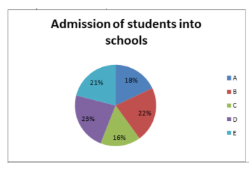
The given pie-chart shows the number of students admitted into various schools, A, B, C, D, E, in a town. The total number of students is 6500. The number of boys in each school is given by the table. Study the pie-chart and the table carefully and answer the question that follows.
Note: For the purpose of calculation, the degree distributions for schools A, B, C, D, and E in the pie chart correspond to total strength proportions that yield total students as follows: A = 1400, B = 1500, C = 1000, D = 1100, E = 1500 (Total = 6500).
Schools A B C D E
Number of boys 800 850 600 700 765
The total number of boys in schools A, C, D is what percentage of the total number of girls in schools B, C, E (rounded to 2 decimal places)?
Refer to the below data table and answer the following question:
Refer the below data table and answer the following Question.
Designation Number of employees Annual salary (in lakhs) Bonus as percent of annual salary
Manager 16 6 20%
Executive 51 6 30%
Trainee 12 2 20%
What is the average bonus (in rupees)?
Designation Number of employees Annual salary (in lakhs) Bonus as percent of annual salary
Manager 16 6 20%
Executive 51 6 30%
Trainee 12 2 20%
What is the average bonus (in rupees)?
Refer to the below data table and answer the following question:
Marks Number of students
40 and above 21
30 and above 45
20 and above 70
10 and above 83
0 and above 95
How many students have scored marks 20 or more but less than 40?
Marks Number of students
40 and above 21
30 and above 45
20 and above 70
10 and above 83
0 and above 95
How many students have scored marks 20 or more but less than 40?
Refer to the below data table and answer the following question:
Division / Standard Boys Girls
Division A / Standard 5 30 10
Division B / Standard 5 25 25
Division C / Standard 5 10 20
Division A / Standard 6 40 20
Division B / Standard 6 40 15
Division C / Standard 6 30 10
What is the overall ratio of boys to girls across all divisions and standards combined?
Division / Standard Boys Girls
Division A / Standard 5 30 10
Division B / Standard 5 25 25
Division C / Standard 5 10 20
Division A / Standard 6 40 20
Division B / Standard 6 40 15
Division C / Standard 6 30 10
What is the overall ratio of boys to girls across all divisions and standards combined?
Refer to the below data table and answer the following question.
Subjects Marks scored
English 70
Hindi 55
Math 70
Science 55
Arts 55
Five points are to be deducted from this student's average of marks scored because of poor attendance. What will be this student's net average marks scored?
Subjects Marks scored
English 70
Hindi 55
Math 70
Science 55
Arts 55
Five points are to be deducted from this student's average of marks scored because of poor attendance. What will be this student's net average marks scored?
Refer to the below data table and answer the following question.
Marks Number of students
40 and above 25
30 and above 44
20 and above 56
10 and above 86
0 and above 100
How many students have scored marks 20 or more but less than 40?
Marks Number of students
40 and above 25
30 and above 44
20 and above 56
10 and above 86
0 and above 100
How many students have scored marks 20 or more but less than 40?
Refer the below data table and answer the following Question.
Quantity of stock Average Cost (Rs)
Mobile Phones 88
Cameras 69
TVs 20
Refrigerators 82
ACs 99
What is the value of the total stock (in lakh rupees)?
Quantity of stock Average Cost (Rs)
Mobile Phones 88
Cameras 69
TVs 20
Refrigerators 82
ACs 99
What is the value of the total stock (in lakh rupees)?
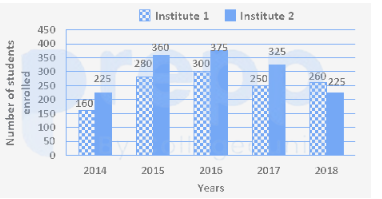
The following bar graph shows the number of students enrolled in Institutes A and B during 5 years (2014 to 2018).
Assume the values for 2017 are A=250,B=280; for 2018 are A=320,B=280; and for 2016, institute B=200.
What is the ratio of the total number of students enrolled in both the institutes during 2017 and 2018 to that of the number of students enrolled in institute B for the year 2016?
Assume the values for 2017 are A=250,B=280; for 2018 are A=320,B=280; and for 2016, institute B=200.
What is the ratio of the total number of students enrolled in both the institutes during 2017 and 2018 to that of the number of students enrolled in institute B for the year 2016?
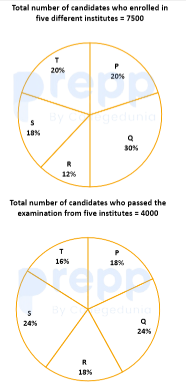
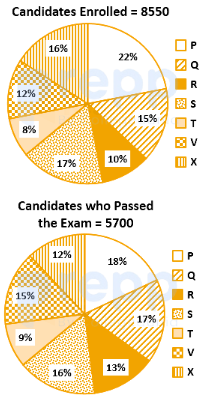
The following distribution represents candidates who were enrolled for a competitive examination, and the candidates (out of those enrolled) who passed the exam from five different institutes P, Q, R, S and T.
Suppose the total number of enrolled candidates is 7500 with distribution: P = 22%, Q = 30%, R = 10%, S = 18%, T = 20%.
The total number of passed candidates is 4000 with distribution: P = 18%, Q = 24%, R = 14%, S = 22%, T = 22%.
The total number of candidates who enrolled in institutes P, R and T together is what percentage more than the number of candidates who passed from institutes P, R and T together?
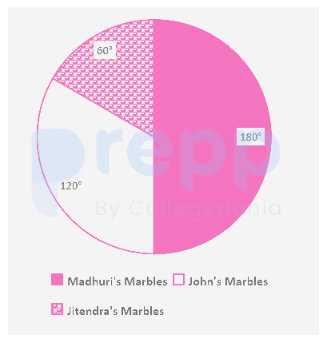
Study the given pie-chart and answer the question that follows.
If the pie-chart shows the distribution of 36 marbles among 3 persons (where Madhuri's share corresponds to an angle of 160
∘
in the circle), then the number of marbles Madhuri has is:
If the pie-chart shows the distribution of 36 marbles among 3 persons (where Madhuri's share corresponds to an angle of 160
∘
in the circle), then the number of marbles Madhuri has is:
The given bar graph reflects the data on the favourite colours of several students in a class. Suppose the students are divided into two groups, A and B, with those in Group A choosing one of Red, Green, Orange or Pink as their favourite colour and those in Group B choosing any of the other four colours as the favourite. How many more students were there in Group A than in Group B as per the bar graph?
(Note: Based on standard textbook data for this specific problem, the number of students are: Red = 43, Green = 19, Orange = 34, Pink = 27, and the other four colours are Blue = 31, Yellow = 49, Black = 18, White = 23).
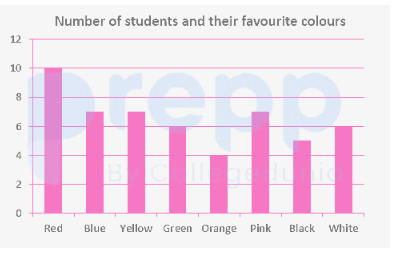
(Note: Based on standard textbook data for this specific problem, the number of students are: Red = 43, Green = 19, Orange = 34, Pink = 27, and the other four colours are Blue = 31, Yellow = 49, Black = 18, White = 23).
The following chart represents the demand and production of five companies V, W, X, Y and Z.
If K% of the production of company W equals the production of company Z, then K equals:
(Note: Based on the standard exam data for this problem, the production of company W is 40 units and the production of company Z is 60 units.)
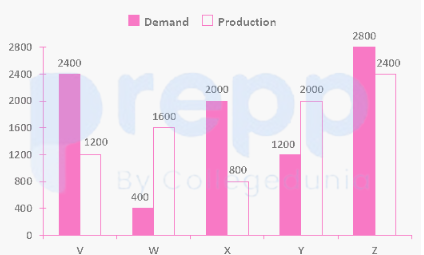
If K% of the production of company W equals the production of company Z, then K equals:
(Note: Based on the standard exam data for this problem, the production of company W is 40 units and the production of company Z is 60 units.)
Directions: The following pie charts represent the distribution of candidates who were enrolled for an entrance examination and the candidates (out of those enrolled) who passed the examination in different institutes (). Total Enrolled Candidates = Percentage Distribution of Enrolled Candidates: Total Passed Candidates = Percentage Distribution of Passed Candidates: Study the charts and answer the question that follows. The number of candidates who passed from institutes and together exceeds the number of candidates who enrolled from institutes and together by:
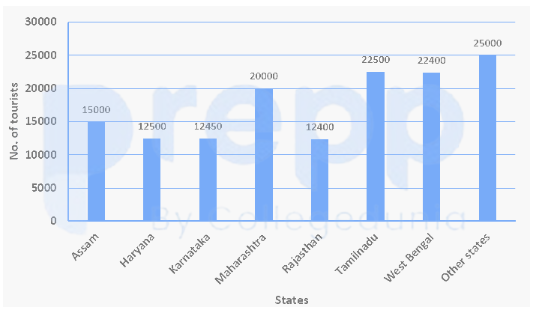
The number of tourists visiting various states is given as follows:Maharashtra = Karnataka = Rajasthan = Haryana = Assam = Kerala = Goa = The number of tourists to which of the following states is less than of the total number of tourists?
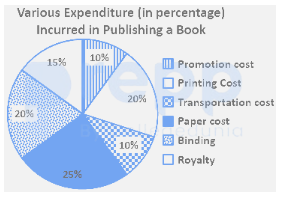
The percentage distribution of the expenditure incurred in publishing a book is as follows:Printing Cost = Paper Cost = Royalty = Binding = Promotion Cost = Transportation Cost = If copies are published and the printing cost for them amounts to , then what should be the selling price of a book such that the publisher can earn a profit of ?
The following table shows the number of boys and the number of girls in 5 different classes, C1 to C5, of a school.
Class Boys Girls
C1 25 25
C2 30 20
C3 15 25
C4 28 32
C5 26 24
The number of boys in C5 is approximately what percent of the average number of girls per class?
Class Boys Girls
C1 25 25
C2 30 20
C3 15 25
C4 28 32
C5 26 24
The number of boys in C5 is approximately what percent of the average number of girls per class?
The following table gives the number of patients visiting a dental clinic for the issues related to their oral health during the months September, October, November and December 2018. Study the table carefully and answer the question that follows.
Month (2018) Filling Root canal Tooth extraction Implants
September 180 480 570 260
October 560 770 620 470
November 940 1080 890 220
December 820 590 530 1040
What is the ratio of the total number of patients in September to the total number of patients in December in 2018?
Month (2018) Filling Root canal Tooth extraction Implants
September 180 480 570 260
October 560 770 620 470
November 940 1080 890 220
December 820 590 530 1040
What is the ratio of the total number of patients in September to the total number of patients in December in 2018?
Study the given table and answer the question that follows.
The table shows the total number of batteries sold by a company (in lakhs) over the years.
The table shows the total number of batteries sold by a company (in lakhs) over the years.
Study the following table, (which shows the number of units of an item manufactured and sold by companies) and answer the question.CompanyNo. of units Manufactured (in thousands)Sold (in thousands)A4230B4532C3626D5136E5440What percent of total number of units sold by companies A, B and D is equal to the number of units manufactured by company C? (correct to one decimal place)
The average of numbers is . The average of the first numbers is and that of the last numbers is . If the number is excluded, then what is the average of the remaining numbers? (correct to one decimal place)
Study the following table, (which shows the number of units of an item manufactured and sold by companies) and answer the question.CompanyNo. of units Manufactured (in thousands)Sold (in thousands)A4230B4532C3626D5136E5440The ratio of the number of units manufactured by companies C and E together and the number of units sold by A and D together is?
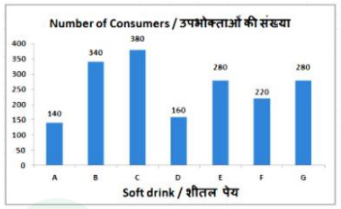
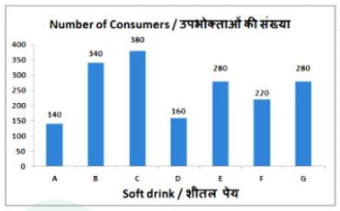
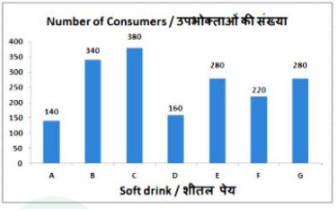
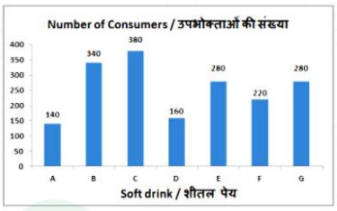
If 20% of consumers of drink A start consuming drink E instead, then the consumers of drink E would increase by how many units?
Refer the below data table and answer the following Question.
Refer the below data table and answer the following Question.
Measured on Birthday Height of the child (in cms)
4 100
5 110
6 115
7 125
8 135
9 145
10 155
11 160
12 165
13 170
14 175
15 180
16 185
What was the increase in the height of the child from the 8th Birthday to the 15th Birthday?
Measured on Birthday Height of the child (in cms)
4 100
5 110
6 115
7 125
8 135
9 145
10 155
11 160
12 165
13 170
14 175
15 180
16 185
What was the increase in the height of the child from the 8th Birthday to the 15th Birthday?
Refer the below data table and answer the following Question.
Sleep Stage Percentage
Deep Sleep 25
Dreaming 5
Light sleep 10
Extremely light sleep 5
Awake 55
Between 10pm to 6am, a fitness band records the following data. How long was the user Dreaming or was in Extremely light sleep?
Sleep Stage Percentage
Deep Sleep 25
Dreaming 5
Light sleep 10
Extremely light sleep 5
Awake 55
Between 10pm to 6am, a fitness band records the following data. How long was the user Dreaming or was in Extremely light sleep?
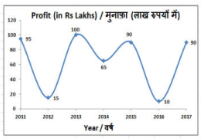
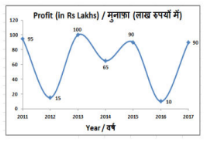
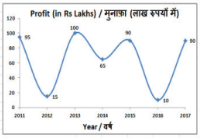
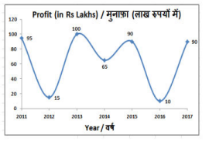
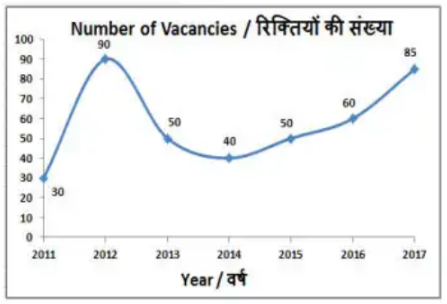
Directions for Q.67 to Q.70: Based on typical data interpretation line graphs showing vacancies for accountants in a company over the years where the data values are:
2011: 30
2012: 40
2013: 80
2014: 90
2015: 110
2016: 60
2017: 70
In which year were the number of vacancies lesser than that of the previous year?

2011: 30
2012: 40
2013: 80
2014: 90
2015: 110
2016: 60
2017: 70
In which year were the number of vacancies lesser than that of the previous year?
What was the difference in the number of vacancies between the years 2012 and 2014?

The number of vacancies in 2014 were lesser than that in 2015 by:
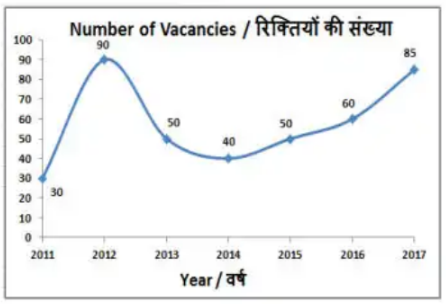
The salary of an accountant in the company is ₹40,000, then what was the increase in the expense (in ₹ lakhs) due to salaries that had to be paid when posts were filled for the vacancies in the year 2014?
Study the given graph and answer the following question.
Suppose the total production of barley over 4 years is 500 tonnes, and the average production of wheat, rice, and barley in 2017 is 120 tonnes.
45% of the total production of barley in the given 4 years is what per cent more than the average production (per year) of wheat, rice and barley in 2017?
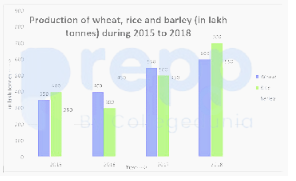
Suppose the total production of barley over 4 years is 500 tonnes, and the average production of wheat, rice, and barley in 2017 is 120 tonnes.
45% of the total production of barley in the given 4 years is what per cent more than the average production (per year) of wheat, rice and barley in 2017?
Refer the below data table and answer the following Question.
Refer the below data table and answer the following Question.
Refer the below data table and answer the following Question.
India's exports in 2015 Value in million US$
Jewellery 1000
Software 725
Cotton 700
Steel 700
Electronics 700
Jewellery was what percent of total exports?
India's exports in 2015 Value in million US$
Jewellery 1000
Software 725
Cotton 700
Steel 700
Electronics 700
Jewellery was what percent of total exports?
Directions for Q.67 to Q.70: The bar graph shows the results of a survey carried out within a club. The members of the club were asked which soft drink they consumed. Study the diagram and answer the following questions.
(Note: Based on standard dataset parameters for this specific official problem)
Soft Drink Consumption Levels: A = 25, B = 30, C = 15, D = 10, E = 20, G = 5
Which soft drink was consumed the second highest?
(Note: Based on standard dataset parameters for this specific official problem)
Soft Drink Consumption Levels: A = 25, B = 30, C = 15, D = 10, E = 20, G = 5
Which soft drink was consumed the second highest?
What is the ratio of consumers of soft drink B to consumers of soft drink E?
SSC CGL Data Interpretation — FAQ
How many Data Interpretation questions come in SSC CGL?▼
Our database has 91 Data Interpretation questions from SSC CGL covering 2026 to 2026.
What difficulty are SSC CGL Data Interpretation questions?▼
The 91 SSC CGL Data Interpretation questions include 8 easy, 82 medium and 1 hard level questions.
Where can I find more Data Interpretation questions for other exams?▼
Visit /tag/data-interpretation to see all Data Interpretation questions across all exams including Competitive Exam, Staff Selection Commission, Prepp.