Practice Test
Data Interpretation Questions
16 Data Interpretation questions from Practice Test with detailed answers and explanations. Free previous year questions and MCQs.
📚
16
Questions
🟢
0
Easy
🟡
16
Medium
🔴
0
Hard
Years:2026 (16)
Data Interpretation — Practice Test(1–16 of 16)
Filter:
The given graph shows the screen time and night sleep in hours across different age groups. Which age group has the lowest screen time and the highest night
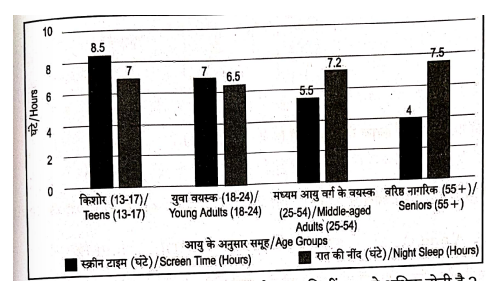
sleep?
sleep?
A company's revenue (in ) for five years is listed as:
* 2018 :
* 2019 :
* 2020 :
* 2021 :
* 2022 :
What is the percentage increase in revenue from 2020 to 2022?
* 2018 :
* 2019 :
* 2020 :
* 2021 :
* 2022 :
What is the percentage increase in revenue from 2020 to 2022?
The given table shows the percentage distribution of employees working in different departments of an organization.
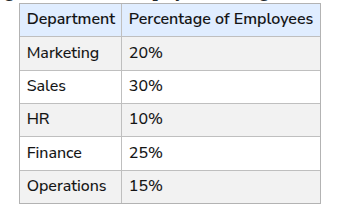
If there are a total of 1700 employees, find the number of employees in the Finance department.
If there are a total of 1700 employees, find the number of employees in the Finance department.
The given table provides the sales data of cellular phones from the years 2019 to 2024.
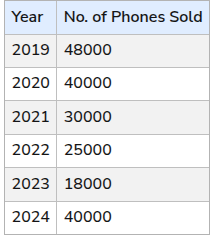
Based on the data, what was the percentage decrease in sales from 2020 to 2021?
Based on the data, what was the percentage decrease in sales from 2020 to 2021?
Temperatures (in ) recorded in a city for six days are as follows:
What is the range of the recorded temperatures?
What is the range of the recorded temperatures?
A student's marks in six subjects are recorded as follows:
Physics: , Chemistry: , Mathematics: , Biology: , English: , Computer: .
If the minimum passing marks are in each subject, what percentage of the total subjects did the student fail in?
Physics: , Chemistry: , Mathematics: , Biology: , English: , Computer: .
If the minimum passing marks are in each subject, what percentage of the total subjects did the student fail in?
The given table shows the revenue (in crore rupees) of a company from different sources over five years. Study the table carefully and answer the question.
In 2019, what percent of the company's total income came from export earnings?
In 2019, what percent of the company's total income came from export earnings?
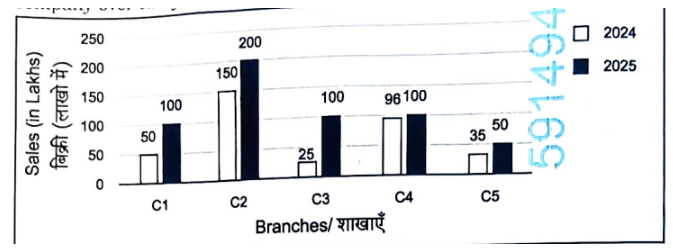
The given graph shows the sales (in lakhs) made by five different branches ( to ) of a company over two years - and . Use the data to answer the given question.
Which branch recorded the highest combined sales across and ?
Which branch recorded the highest combined sales across and ?
The table shows the marks obtained by five students in Mathematics and Physics. Refer to the table to answer the question.
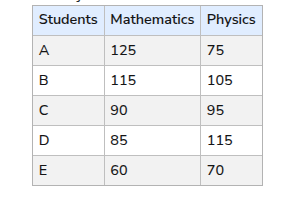
If the marks obtained by E in Mathematics are increased by of the original marks, what will be his new percentage in Mathematics, assuming the maximum marks are ?
If the marks obtained by E in Mathematics are increased by of the original marks, what will be his new percentage in Mathematics, assuming the maximum marks are ?
Mobile phones sold by a store in six months are as follows:
January: 320, February: 280, March: 400, April: 360, May: 450, June: 390.
What is the percentage decrease in sales from May to June?
January: 320, February: 280, March: 400, April: 360, May: 450, June: 390.
What is the percentage decrease in sales from May to June?
Tourists visiting a hill station during the selected months are as follows:
May: 4000, June: 5200, July: 6000, August: 5500.
What is the percentage increase in tourists from May to July?
May: 4000, June: 5200, July: 6000, August: 5500.
What is the percentage increase in tourists from May to July?
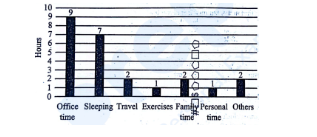
A bar graph shows the number of hours spent on various daily activities: Sleep: 8 hours, Office: 9 hours, Entertainment: 2 hours, Travel: 2 hours, Others: 3 hours. From the given data, calculate the number of hours spent on both travel and office time together.
The bar graph shows information about the sales of wrist watches from five branches and of company 'ABC' in 2016 and 2017. If the sum of sales of all branches in 2016 is units and in 2017 is units, find the ratio of total sales of all branches for the year
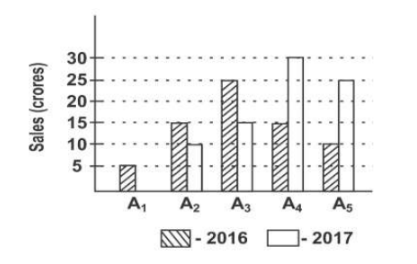
2016 to 2017.
2016 to 2017.
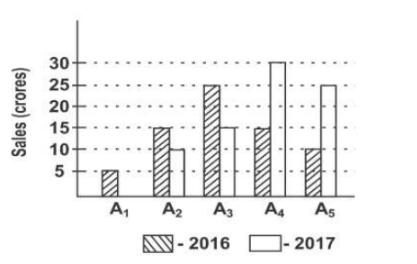
The bar graph shows information about the sales of wrist watches from five branches and of company 'ABC' in 2016 and 2017.
Let the sales values for be (in 2016) and (in 2017), and for be (in 2016) and (in 2017).
What is the ratio of total sales of branches and for the year 2016 to the year 2017?
Study the given table and answer the following question.
State Covid 19 cases in thousand Sep 2021 Covid 19 cases in thousand Oct 2021 Covid 19 cases in thousand Nov 2021 Covid 19 cases in thousand Dec 2021
Maharashtra 50 65 55 50
UP 40 48 40 30
Bihar 50 55 48 30
Tamil Nadu 40 45 40 25
Kerala 20 25 22 15
Total number of Covid 19 cases in Dec 2021 is what percentage of the total number Covid 19 cases in Sep 2021 for these five states together?
In a school, periodical examinations are held every two months. During the academic session from April 2001 to March 2002, a Class IX student appeared in each of these periodical exams. The line graph below shows the total marks obtained by the student in each periodical exam. Maximum Total Marks in each periodical exam = 500.
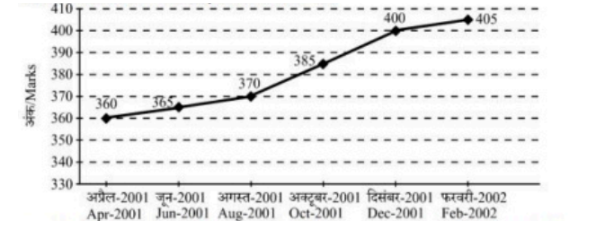
What is the percentage of the marks obtained by the student in the periodical exams of August 2001 and October 2001 combined?
What is the percentage of the marks obtained by the student in the periodical exams of August 2001 and October 2001 combined?
Practice Test Data Interpretation — FAQ
How many Data Interpretation questions come in Practice Test?▼
Our database has 16 Data Interpretation questions from Practice Test covering 2026 to 2026.
What difficulty are Practice Test Data Interpretation questions?▼
The 16 Practice Test Data Interpretation questions include 0 easy, 16 medium and 0 hard level questions.
Where can I find more Data Interpretation questions for other exams?▼
Visit /tag/data-interpretation to see all Data Interpretation questions across all exams including SSC CGL, Competitive Exam, Staff Selection Commission.