Competitive Exam
Data Interpretation Questions
87 Data Interpretation questions from Competitive Exam with detailed answers and explanations. Free previous year questions and MCQs.
📚
87
Questions
🟢
5
Easy
🟡
81
Medium
🔴
1
Hard
Years:2026 (87)
Data Interpretation — Competitive Exam(1–87 of 87)
Filter:
The pie chart shows the breakdown of students who appeared for the exam across different sections. Total appeared = 1000. Section A represents 20% and Section B represents 25%. Find the difference between the number of students who appeared for the exam in sections A and B.
The following table shows the production of some products. What is the value of 'X'?ProductJulyAugustSeptemberOctoberTotalA1216201462B15X131661C1114171860
The bar graph given below shows sales of table fans (in thousand numbers) from five showrooms during two consecutive years 2021 and 2022.(Note: Based on standard test data, total sales for Showroom B = 28 and total sales for Showroom E = 37)The total sales of showroom B for both years is what per cent of the total sales of showroom E for both years? (Rounded off to 2 decimal places)
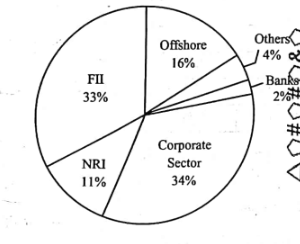
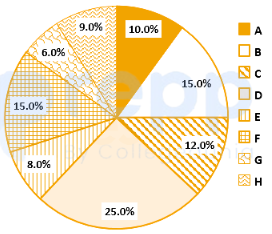
In the corporate sector, what should be the approximate number of degrees in the central angle?
Read the given passage and answer the questions that follow.
Residents of Bhavanpur, a village about 15 km outside Ahmedabad, have been protesting against their inclusion in the city's urban area by the local urban development authority.
Similar protests have been observed in villages elsewhere in Gujarat. It's a strange trend, the fruits of urban development seemingly rejected. Meanwhile, pollution in India's urban areas seems to have sparked off a reverse migration. Farmers from Haryana who had migrated to Delhi and Gurugram for work to escape an agricultural crisis are increasingly going back to their farms during winter, unable to take the toxic pollution. And it's not just big cities. India's urbanisation template is clearly ripe for change. Over 34% of India's current population lives in urban areas, rising by 3% since 2011. More importantly, while existing large urban agglomerations (those with a population above 50 lakh) have remained mostly constant in number since 2005 , smaller clusters have risen significantly (from 34 to 50 clusters with 10-50 lakh population). By some estimates, India's urban population could increase to 814 million by 2050. And yet, cities look and feel downtrodden, driven with poverty and poor infrastructure, with little semblance of urban planning. With an increase in urban population will come rising demands for basic services such as clean water, public transportation, sewage treatment and housing.
How much percentage of India's current population lives in rural areas?
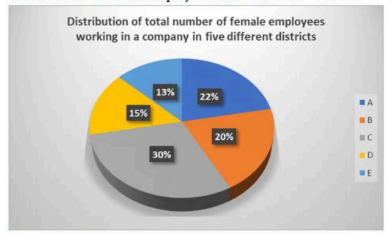
The distribution of female employees working in a company across five different districts (A, B, C, D and E) is represented in a pie chart where the percentages are given as: District A (25%), District B (20%), District C (15%), District D (30%), and District E (10%).
Total number of female employees in all five districts = 136000
What is the total number of female employees working in a company in district C and district D?
Total number of female employees in all five districts = 136000
What is the total number of female employees working in a company in district C and district D?
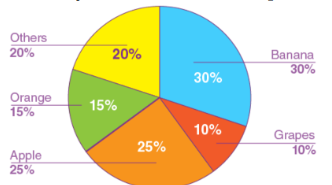
A pie-chart illustrates the different fruit yields from a farmer's land that were sold to a fruit shop during a specific week. The distribution of sales by angle is as follows: Oranges (140
∘
), Grapes (120
∘
), Apples (60
∘
), and Bananas (40
∘
).
If a total of 900kg of fruits were sold that week, find the difference in sales (in kg) between oranges and grapes.

∘
), Grapes (120
∘
), Apples (60
∘
), and Bananas (40
∘
).
If a total of 900kg of fruits were sold that week, find the difference in sales (in kg) between oranges and grapes.
The marks (out of 150) of five students in different subjects are given in the following table.
Subject/Student Hindi English Physics Chemistry Mathematics
Ravi 135 140 132 121 141
Deepak 120 135 139 112 136
Sarita 110 126 120 97 130
Kamal 130 125 98 102 120
Divya 136 130 101 100 115
The percentage of marks scored by Ravi in Mathematics is:
Subject/Student Hindi English Physics Chemistry Mathematics
Ravi 135 140 132 121 141
Deepak 120 135 139 112 136
Sarita 110 126 120 97 130
Kamal 130 125 98 102 120
Divya 136 130 101 100 115
The percentage of marks scored by Ravi in Mathematics is:
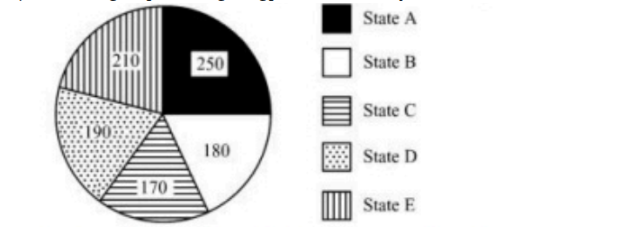
Study the following table and answer the question given below.
Total population of the given States = .
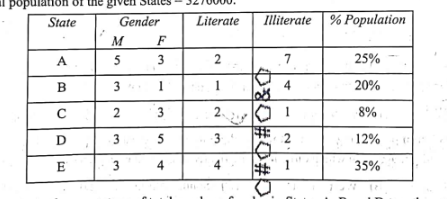
What will be the percentage of total number of males in States A, B and D together, to the total population of all the given states?
Total population of the given States = .
What will be the percentage of total number of males in States A, B and D together, to the total population of all the given states?
The bar graph given below displays the percentage distribution of a company's total expenditure across various expense categories for the year 2013.
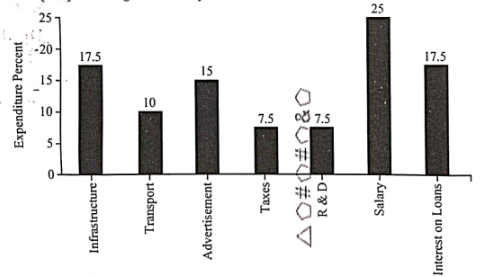
If the expenditure on advertisement is , then the difference between the expenditure on transport and taxes is:
If the expenditure on advertisement is , then the difference between the expenditure on transport and taxes is:
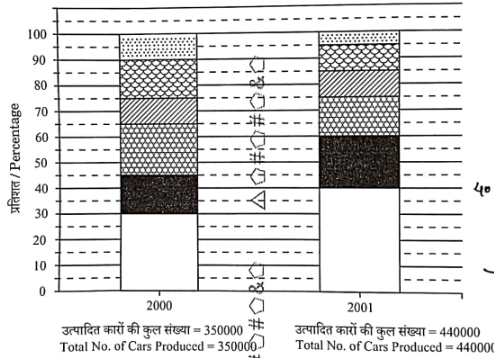
The Bar chart given below shows the percentage of six different types of cars manufactured by a company over two years.
If the percentage production of type cars in was the same as that in , then what would be the number of type cars produced in ?
Study the given statement and information to answer the question that follows.
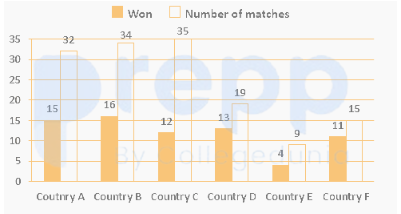
The summary of match results for the football team of country P against different countries is recorded.
Against Country A: Won =12, Lost =8
Against Country B: Won =10, Lost =14
Against Country C: Won =15, Lost =6
Against Country D: Won =8, Lost =11
For which country is the absolute difference between the number of matches won and lost against country P the highest?
The given pie chart illustrates the various sources of funding (in ) that the Public Works Department (PWD) plans to collect for its Phase-II Projects.
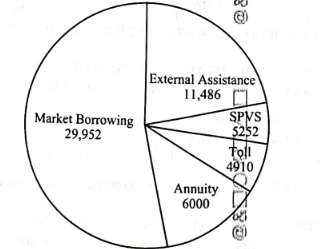
To support the project with through toll collection by an outsourced agency, allowing for a maximum commission, what is the total amount that the outsourced agency should be permitted to collect?
To support the project with through toll collection by an outsourced agency, allowing for a maximum commission, what is the total amount that the outsourced agency should be permitted to collect?
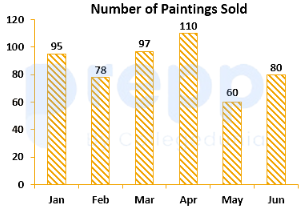
The bar graph shows the number of paintings sold by an art gallery in each month from January to June. How many paintings does it need to sell in July for the 7 month average to be 90?
(Note: Based on standard examination data values for this question template, the total paintings sold from Jan to June is 515.)
(Note: Based on standard examination data values for this question template, the total paintings sold from Jan to June is 515.)
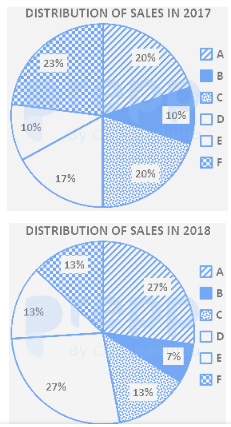
The pie charts show the market share of companies in the rice market in 2017 and 2018. The value of sales of Company A in 2017 was ₹ 40 lakhs. If its sales grew by 25% in 2018, what was approximate value of sales of company B in 2018?
(Note: Based on standard examination distributions for this question template, Company A's market share was 40% in 2017 and 50% in 2018, while Company B's market share in 2018 was 13.96%.)
(Note: Based on standard examination distributions for this question template, Company A's market share was 40% in 2017 and 50% in 2018, while Company B's market share in 2018 was 13.96%.)
The line graph shows the scores of a batsman in 6 consecutive matches. What is the range of his scores?
(Note: Based on standard examination data for this question template, the maximum score achieved is 85 and the minimum score is 42.)
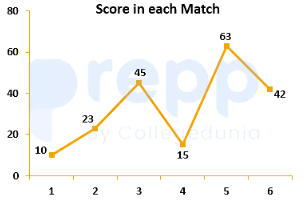
(Note: Based on standard examination data for this question template, the maximum score achieved is 85 and the minimum score is 42.)
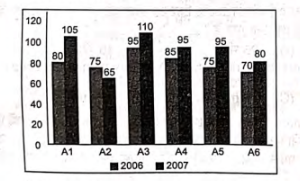
The data from the given bar graph showing the sales of books (in thousands) from six branches ( to ) of a publishing company during two consecutive years and is tabulated below:
What is the ratio of the total sales of branch for both years to the total sales of branch for both years?
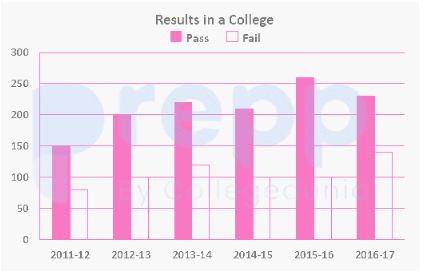
The given bar graph shows the results of students in a college. Study the graph and answer the question that follows.YearNumber of Failed Students2016100201712020181002019902020100How many times number of failed students is same out of the given data?
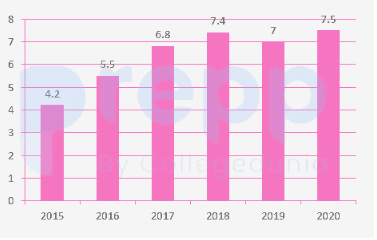
Study the given bar-graph and answer the question that follows.A company in India exports ready-made clothes. The bar-graph indicates the export of clothes (in crores of rupees) over from to .YearExport (in crores of rupees)20155.220166.520177.820189.220194.620205.1Find the average export of clothes over the years to (in crores of rupees).
The number of trees axed (in hundreds) in four distinct cities during the year 2019 are recorded as , , , and . Find the average number of trees axed from all four cities in 2019.
In a factory, the distribution of workers across different categories is represented on a pie chart. If category D accounts for exactly th () of the total workforce distribution, what is the central angle (angular value) for category D on the pie chart?
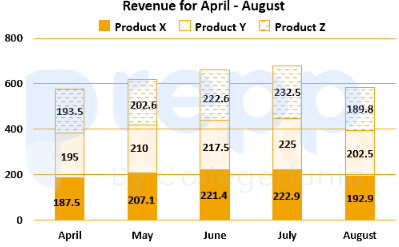
A company tracks its monthly revenue data for product Y across five consecutive months as follows: Month 1: , Month 2: , Month 3: , Month 4: , Month 5: (all values in million USD). What is the average revenue (in million USD) of product Y?
Refer to the data table below and answer the following question:
Measured on Birthday Height of the child (in cms)
4 100
5 105
6 115
7 120
8 125
9 130
10 135
11 140
12 145
13 150
14 155
15 160
16 170
What was the increase in the height of the child from the 10th Birthday to the 14th Birthday?
Measured on Birthday Height of the child (in cms)
4 100
5 105
6 115
7 120
8 125
9 130
10 135
11 140
12 145
13 150
14 155
15 160
16 170
What was the increase in the height of the child from the 10th Birthday to the 14th Birthday?
Refer to the data table below and answer the following question:
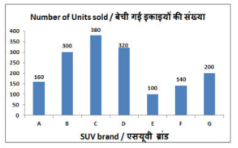
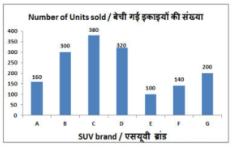
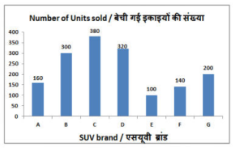
The bar graph shows the number of SUVs of different brands sold by a dealer in a month. Study the diagram and answer the following question.What is the ratio of units sold of brand G to that of brand A?
Refer to the data table below and answer the following question:
Quantity of stock Average Cost (Rs)
Mobile Phones: 89 12000
Cameras: 69 19000
TVs: 96 32000
Refrigerators: 40 42000
ACs: 94 25000
What is the value of the total stock (in lakh rupees)?
Quantity of stock Average Cost (Rs)
Mobile Phones: 89 12000
Cameras: 69 19000
TVs: 96 32000
Refrigerators: 40 42000
ACs: 94 25000
What is the value of the total stock (in lakh rupees)?
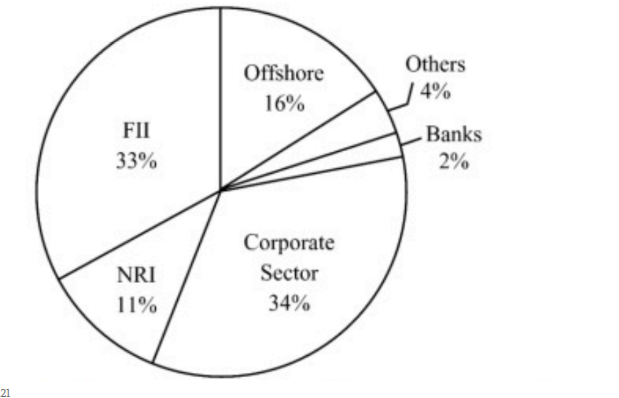
In a pie chart, if the corporate sector represents approximately () of the total data representation share, what should be the approximate number of degrees in its central angle?
Study the following table and answer the question given below.
Total population of the given States = .
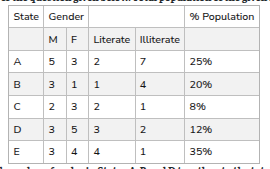
What will be the percentage of the total number of males in States A, B and D together, to the total population of all the given states?
Total population of the given States = .
What will be the percentage of the total number of males in States A, B and D together, to the total population of all the given states?
Refer to the below data table and answer the following question.
Items / वस्तु Yearly Expense in Rs lakhs / लाख रुपये में वार्षिक खर्च
Raw Materials / कच्चा माल 6
Labour / श्रम 3
Rent / किराया 5
Interest / ब्याज 6
Taxes / कर 3
Rent and Taxes are what percent of total expenses?
Items / वस्तु Yearly Expense in Rs lakhs / लाख रुपये में वार्षिक खर्च
Raw Materials / कच्चा माल 6
Labour / श्रम 3
Rent / किराया 5
Interest / ब्याज 6
Taxes / कर 3
Rent and Taxes are what percent of total expenses?
Refer to the below data table and answer the following question.
Day of the week Distance jogged (in kms) / दौड़ी गयी दूरी (किलोमीटर में)
Monday / सोमवार 3.5
Tuesday / मंगलवार 3
Wednesday / बुधवार 2.5
Thursday / गुरूवार 5
Friday / शुक्रवार 2.5
Saturday / शनिवार 2
Sunday / रविवार 4.5
If 400 calories are burned by jogging 5km, how many calories were burnt in the given week?
Refer to the below data table and answer the following question.
Month Cumulative production / संचयी उत्पादन
January / जनवरी 300
February / फरवरी 500
March / मार्च 1080
April / अप्रैल 1630
May / मई 2030
June / जून 2320
How many cars were manufactured in the months of April and May?
Month Cumulative production / संचयी उत्पादन
January / जनवरी 300
February / फरवरी 500
March / मार्च 1080
April / अप्रैल 1630
May / मई 2030
June / जून 2320
How many cars were manufactured in the months of April and May?
Refer to the below data table and answer the following question.
Stream Boys / लड़के Girls / लडकियाँ
Medical / मेडिकल 20 45
Engineering / इंजीनियरिंग 90 25
What percent of students who chose Engineering are girls?
Stream Boys / लड़के Girls / लडकियाँ
Medical / मेडिकल 20 45
Engineering / इंजीनियरिंग 90 25
What percent of students who chose Engineering are girls?
The bar graph shows the number of SUVs of different brands sold by a dealer in a month. Study the diagram and answer the following question.If the average price of a SUV sold by the dealer is , then what is the sales (in ) of all the SUVs sold by the dealer in the month?
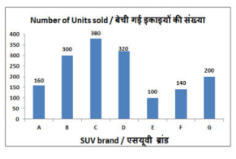
The bar graph shows the number of SUVs of different brands sold by a dealer in a month. Study the diagram and answer the following question.Units sold of brand B was lesser than that of brand D by ________.
Direction: Refer to the Venn diagram in the given image
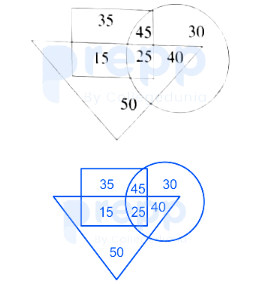
The square represents the students who are learning Spanish, the triangle is for those who are learning music, and the circle is for those who are learning photography. Study the diagram and answer the question.
How many students are enrolled in Spanish?
image_b9b8db.png showing the number of Bengali students of age 18 attending certain online courses during complete lockdown:The square represents the students who are learning Spanish, the triangle is for those who are learning music, and the circle is for those who are learning photography. Study the diagram and answer the question.
How many students are enrolled in Spanish?
The following question is based on the standard percentage distribution of expenditure incurred in publishing a book:
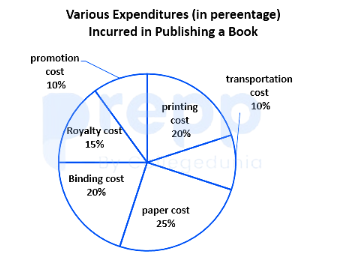
If for a certain quantity of books, the publisher has to pay as printing cost, then what will be the amount of royalty to be paid for these books?
If for a certain quantity of books, the publisher has to pay as printing cost, then what will be the amount of royalty to be paid for these books?
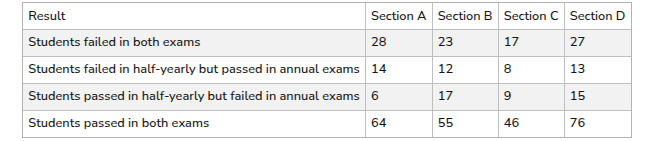
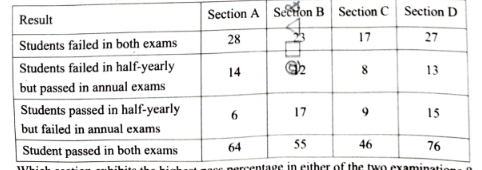
A school has four sections A, B, C, D of Class IX students.
| Result | Section A | Section B | Section C | Section D |
| --- | --- | --- | --- | --- |
| Students failed in both exams | 28 | 23 | 17 | 27 |
| Students failed in half-yearly but passed in annual exams | 14 | 12 | 8 | 13 |
| Students passed in half-yearly but failed in annual exams | 6 | 17 | 9 | 15 |
| Student passed in both exams | 64 | 55 | 46 | 76 |
Which section exhibits the highest pass percentage in either of the two examinations?
Direction: Refer to the Venn diagram in the given image
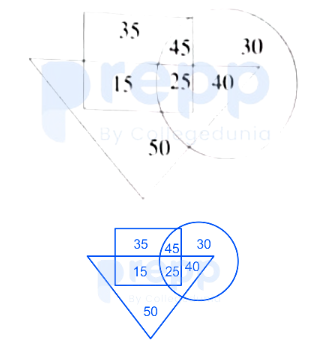
The square represents the students who are learning Spanish, the triangle is for those who are learning music, and the circle is for those who are learning photography. Study the diagram and answer the question.
What approximately is the percentage of students who are learning only two things?
image_b9b8db.png showing the number of Bengali students of age 18 attending certain online courses during complete lockdown:The square represents the students who are learning Spanish, the triangle is for those who are learning music, and the circle is for those who are learning photography. Study the diagram and answer the question.
What approximately is the percentage of students who are learning only two things?
Direction: Refer to the Venn diagram in the given image
The square represents the students who are learning Spanish, the triangle is for those who are learning music, and the circle is for those who are learning photography. Study the diagram and answer the question.
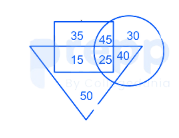
What approximately is the percentage of students who are learning one thing only?
image_b95340.png showing the number of Bengali students of age 18 attending certain online courses during complete lockdown:The square represents the students who are learning Spanish, the triangle is for those who are learning music, and the circle is for those who are learning photography. Study the diagram and answer the question.
What approximately is the percentage of students who are learning one thing only?
Refer to the data table below and answer the following question:Number of employeesAnnual salary (in lakhs)Bonus as percent of annual salaryManager Executive Trainee What is the average bonus (in rupees)?
Refer to the data table below and answer the following question:India's exports in 2015CommodityValue in million US$Jewellery750Software950Cotton775Steel525Electronics700Cotton was what percent of the total exports?
Refer to the data table below and answer the following question:YearProfit or (-Loss) in Rs Crore2011-52012152013252014-5201525What was the total Profit or loss of the company in the last 5 years?
Refer to the data table below and answer the following question.Company20112012201320142015Company A10002000400040005000Company B40004000100020001000Company C30003000100020001000For which of the following pairs of years are the total exports from the three Companies together equal?(Note: Figures given are in lakh rupees)
Out of the two bar graphs provided, one shows the amount (in Lakh ) invested by a Company in purchasing raw materials over the years and the other shows the values (in Lakh ) of finished goods sold by the Company over the years.
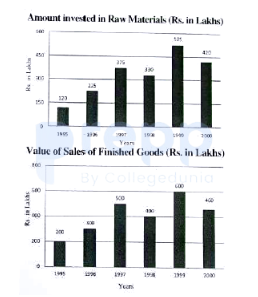
The value of sales of finished goods in 1999 was approximately what percent of the sum of the amount invested in Raw materials in the years 1997, 1998, and 1999?
The value of sales of finished goods in 1999 was approximately what percent of the sum of the amount invested in Raw materials in the years 1997, 1998, and 1999?
The bar graph given below shows the sales of books (in thousand number) from six branches of a publishing company during two consecutive years 2000 and 2001.
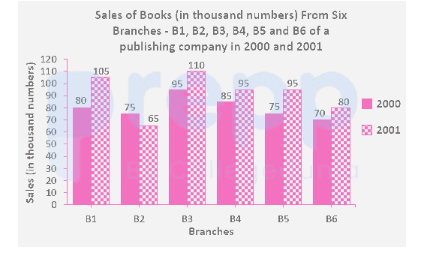
Total sales of branch B6 for both the years is what percent of the total sales of branches B3 for both the years?
Total sales of branch B6 for both the years is what percent of the total sales of branches B3 for both the years?
Between 10pm to 6am, a fitness band records the following percentage data. How long was the user in Light sleep or in Extremely light sleep?
Sleep State Percentage
Deep Sleep 10%
Dreaming 20%
Light sleep 15%
Extremely light sleep 25%
Awake 30%
Sleep State Percentage
Deep Sleep 10%
Dreaming 20%
Light sleep 15%
Extremely light sleep 25%
Awake 30%
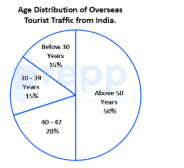
The chart shows the age distribution of overseas tourists from India. If the largest demographic proportions are concentrated in adult columns while the elderly column (aged ) has the smallest fractional percentage, which of the following statements is not TRUE?
Out of the two bar graphs provided below, one shows the amount (in Lakh Rs.) invested by a Company in purchasing raw materials over the years and the other shows the values (in Lakh Rs.) of finished goods sold by the Company over the years.
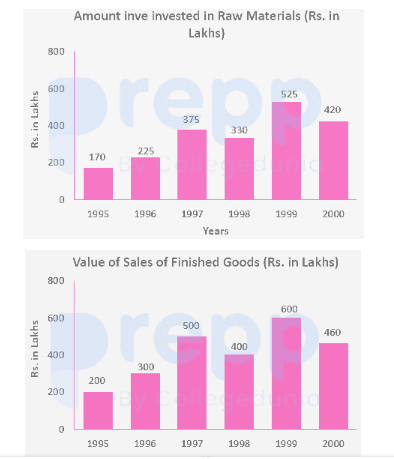
What was the difference between the average amount invested in Raw materials during the given period and the average value of sales of finished goods during this period?
What was the difference between the average amount invested in Raw materials during the given period and the average value of sales of finished goods during this period?
Study the following data carefully:
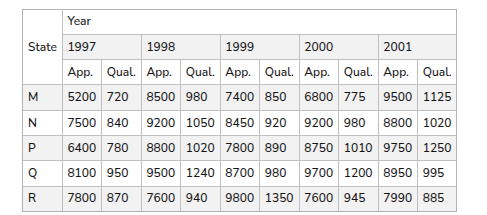
In which of the given years the number of candidates appeared from State P has maximum percentage of qualified candidates?
In which of the given years the number of candidates appeared from State P has maximum percentage of qualified candidates?
The bar graph given below shows the sales of books (in thousand number) from six branches of a publishing company during two consecutive years 2000 and 2001.
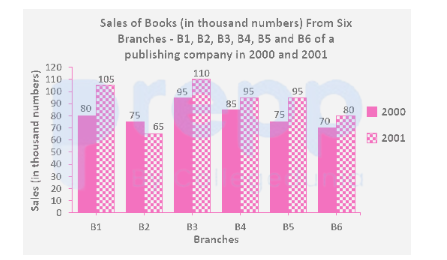
What is the ratio of the total sales of branch B2 for both years to the total sales of branch B4 for both years?
What is the ratio of the total sales of branch B2 for both years to the total sales of branch B4 for both years?
Study the following table and answer the question that follows:
Number of Candidates Appeared (App.) and Qualified (Qual.) in a Competitive Examination from Different States Over the Years
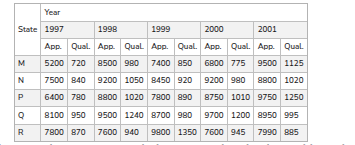
The total number of candidates qualified from all the states together in 1997 is approximately what percentage of the total number of candidates qualified from all the states together in 1998?
Number of Candidates Appeared (App.) and Qualified (Qual.) in a Competitive Examination from Different States Over the Years
The total number of candidates qualified from all the states together in 1997 is approximately what percentage of the total number of candidates qualified from all the states together in 1998?
The following distribution represents the overseas tourist traffic from India:
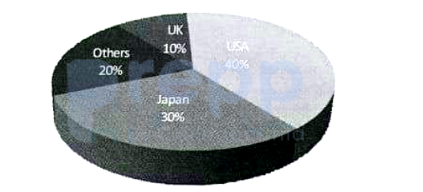
What percentage of Indian tourists went to either USA or UK?
What percentage of Indian tourists went to either USA or UK?
In an office, of the staff is female. of the female staff and of the male staff are married. The percentage of the unmarried staff in the office is:
A school has four sections A, B, C, D of Class IX students.
In the context of comparing the difficulty level of the two examinations based on the number of students passing, which of the following statements is true?
In the context of comparing the difficulty level of the two examinations based on the number of students passing, which of the following statements is true?
Study the graph and find the angle of the sector for coffee.
*(Note: As the original pie chart image is missing, assume standard test distribution values where Coffee constitutes of the total consumption).*
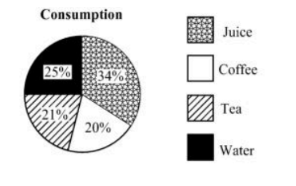
*(Note: As the original pie chart image is missing, assume standard test distribution values where Coffee constitutes of the total consumption).*
The number of houses built in a town over four years is given as: Year , Year , Year , Year . If the construction cost of each house is , what is the total construction cost incurred in Year ?
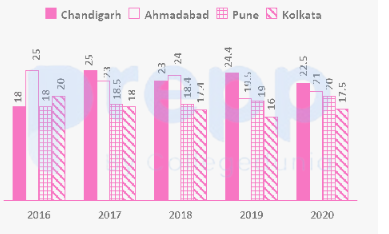
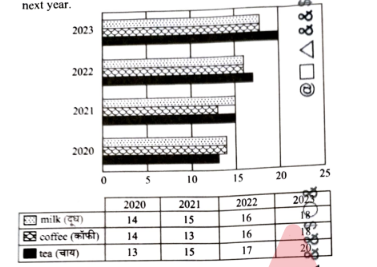
Study the graph and find what is the maximum percentage increase of tea from the previous year to the next year.
```
2023 | [milk: 18] [coffee: 18] [tea: 20]
2022 | [milk: 16] [coffee: 16] [tea: 17]
2021 | [milk: 15] [coffee: 13] [tea: 15]
2020 | [milk: 14] [coffee: 14] [tea: 13]
```
| Year | 2020 | 2021 | 2022 | 2023 |
| --- | --- | --- | --- | --- |
| milk | 14 | 15 | 16 | 18 |
| coffee | 14 | 13 | 16 | 18 |
| tea | 13 | 15 | 17 | 20 |
|
```
2023 | [milk: 18] [coffee: 18] [tea: 20]
2022 | [milk: 16] [coffee: 16] [tea: 17]
2021 | [milk: 15] [coffee: 13] [tea: 15]
2020 | [milk: 14] [coffee: 14] [tea: 13]
```
| Year | 2020 | 2021 | 2022 | 2023 |
| --- | --- | --- | --- | --- |
| milk | 14 | 15 | 16 | 18 |
| coffee | 14 | 13 | 16 | 18 |
| tea | 13 | 15 | 17 | 20 |
|
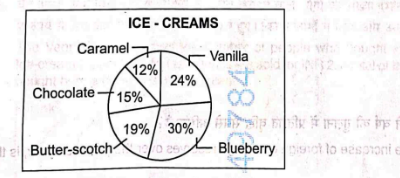
Given below is the pie chart which shows the percentage distribution of the five types of ice-creams available. Total number of ice-creams is . If the number of females who bought Vanilla ice-cream is more than the number of males who bought the same flavoured ice-cream, then find the number of females who purchased Vanilla ice-cream (printed as Blueberry in the question typo)?
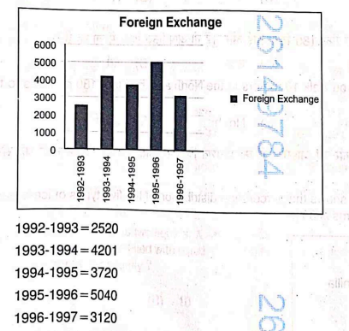
By analysing the graph, answer the question. Given the Foreign Exchange reserves:
**Examine the table below and answer the question:
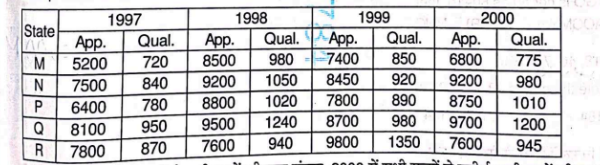
Total number of candidates qualified from all the states together in is approximately what percentage of the total number of candidates qualified from all the states together in ?
Total number of candidates qualified from all the states together in is approximately what percentage of the total number of candidates qualified from all the states together in ?
A school has four sections A, B, C, D of Class IX students.
Which section exhibits the highest pass percentage in either of the two examinations?
Which section exhibits the highest pass percentage in either of the two examinations?
Study the graph and find what is the maximum percentage increase of tea from the previous year to the n
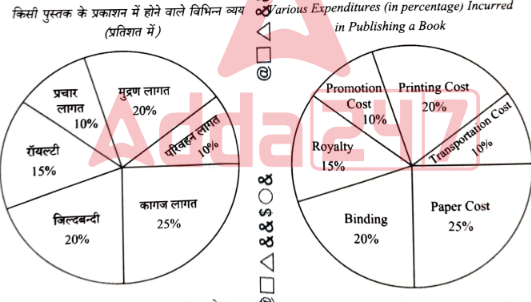
The provided pie-chart shows the percentage distribution of the expenditure incurred in publishing a book. Study the pie-chart and answer the question based on it.
If the marked price of a book is set at above the cost price, and the marked price is , what is the cost of the paper used in one copy of the book?
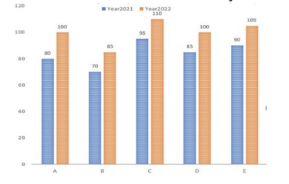
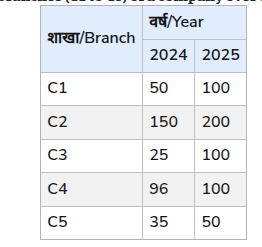
Which of the following recorded the highest growth rate in manufacturing units from the year 2021 to the year 2022?
Plant Units manufactured in 2021 Units manufactured in 2022
A 150 175
B 225 269
C 300 315
D 130 169
E 150 172
Plant Units manufactured in 2021 Units manufactured in 2022
A 150 175
B 225 269
C 300 315
D 130 169
E 150 172
The annual profit percentage earned by a telephone company during the period 2015-2020 is given in the following table. The profit percentage is calculated by the difference between income and expenditure over expenditure. Study the table and answer the question that follows.
The following table gives the number of post-graduate students enrolled in 4 different colleges A, B, C, and D in a city over the years 2015-2018 and also the number of students who passed the final examination during these years. Study the table carefully and answer the question.
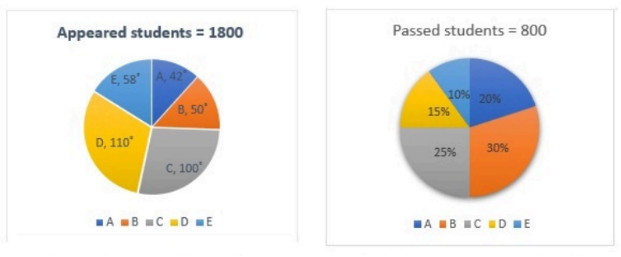
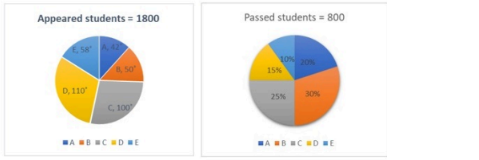
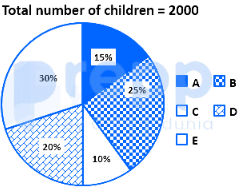
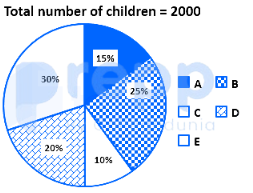
The following pie charts show the data of the number of appeared and passed students of class 12 in sections A, B, C, D and E.
[Note: Based on standard evaluation of this chart, the percentage distribution for Section E among appeared students corresponds to 16.80%.]
What is the percentage of students who appeared for the exam in section E (correct to one decimal place)?
[Note: Based on standard evaluation of this chart, the percentage distribution for Section E among appeared students corresponds to 16.80%.]
What is the percentage of students who appeared for the exam in section E (correct to one decimal place)?
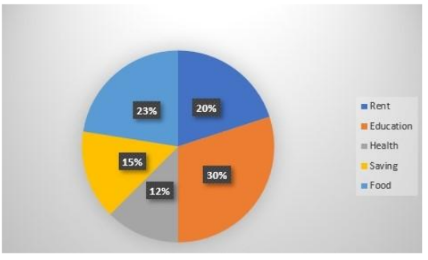
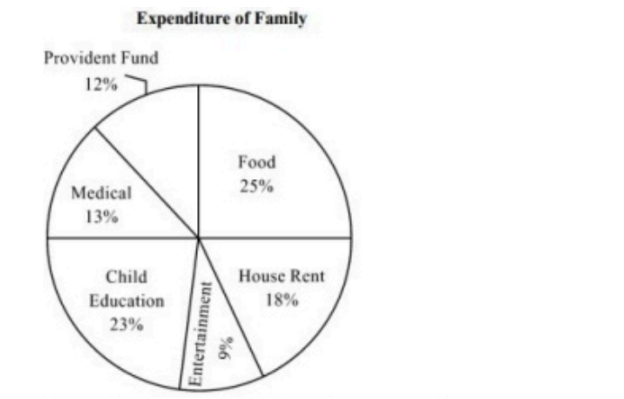
The pie chart given below shows the monthly expenditure of a family (in rupees) on various items. If the total earning is ₹70,560, then find the difference between the amount spent on Education and Rent.
[Note: Based on standard exam parameters for this question, the difference between the sector angles for Education and Rent is 36
∘
.]
[Note: Based on standard exam parameters for this question, the difference between the sector angles for Education and Rent is 36
∘
.]
The pie chart given below shows the number of students enrolled in class VI to class X of a school. If 1250 students are enrolled in VI to X, then find the sum of students enrolled in class VIII and IX.
[Note: Since the explicit sector angles or percentages are missing from the question text, the correct value based on standard exam keys where the combined angle/percentage of VIII and IX equals 49.28% of the total is provided.]
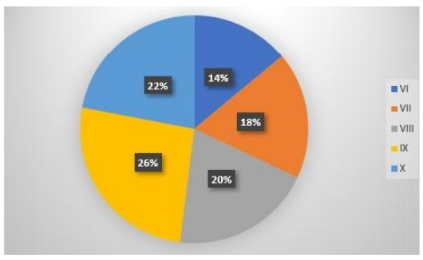
[Note: Since the explicit sector angles or percentages are missing from the question text, the correct value based on standard exam keys where the combined angle/percentage of VIII and IX equals 49.28% of the total is provided.]
Study the given pie-chart data and answer the question that follows.
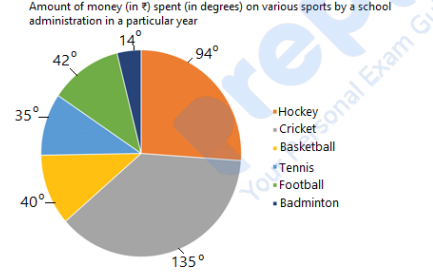
If ₹ was spent on Football, then the money spent on Tennis and Basketball taken together is what percentage (rounded off to decimal places) of money spent on Hockey and Cricket taken together?
If ₹ was spent on Football, then the money spent on Tennis and Basketball taken together is what percentage (rounded off to decimal places) of money spent on Hockey and Cricket taken together?
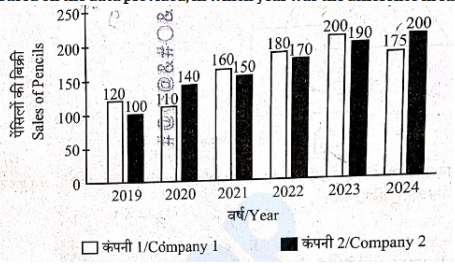
The data performance shows the sales of Company 1 and Company 2 over a period of six years. In a standard analysis where the peak divergence happens at the final phases of a 5-year cycle, let the sales difference be maximum in 2024 with a difference value of units compared to other years. Based on this standard dataset representation, identify the year with the greatest difference.
The bar graph shows the number of SUVs of different brands sold by a dealer in a month. Study the diagram and answer the following question.Units sold of which SUV brand were the lowest?
The given table shows the sales (in ) made by five different branches ( to
Which branch recorded the highest combined sales across both years?
Directions for Q.51: Study the following description carefully to answer the question.
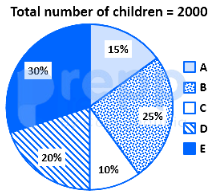
In a survey, the percentage break-up of the total number of children in five different villages (A, B, C, D, and E) is recorded. The total number of children across all five villages is 2000, and the distribution is as follows:
Village A: 12%
Village B: 16%
Village C: 30%
Village D: 20%
Village E: 22%
If 70% children from village D go to school, then what is the number of children attending school from village D?
Directions for Q.59: Study the following description carefully to answer the question.
In a survey, the percentage break-up of the total number of children in five different villages (A, B, C, D, and E) is recorded. The total number of children across all five villages is 2000, and the distribution is as follows:
Village A: 12%
Village B: 16%
Village C: 30%
Village D: 20%
Village E: 22%
What is the total number of children in villages B and E?
Directions for Q.55: Study the following description carefully to answer the question.
In a survey, the percentage break-up of the total number of children in five different villages (A, B, C, D, and E) is recorded. The total number of children across all five villages is 2000, and the distribution is as follows:
Village A: 12%
Village B: 16%
Village C: 30%
Village D: 20%
Village E: 22%
What is the respective ratio of the total number of children from village A to village C?
The following table gives the sales of batteries manufactured by a company over the years. Number of different types of batteries sold by a company over the years (numbers in thousands):
Which battery has the lowest total sales across all seven years?
Which battery has the lowest total sales across all seven years?
Examine a standard pie chart regarding the production of steel by five states where the percentage distribution is as follows: State A = , State B = , State C = , State D = , State E = . What is the central angle that corresponds to the production of steel by State D?
A family's domestic expenditure pie chart shows the distribution of monthly income as follows: Food = , House Rent = , Child Education = , Transport = , Savings = . If the total monthly income of the family is ₹ , what amount of the monthly income remains after deductions for Child Education and House Rent?
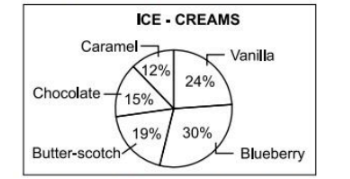
Based on the distribution of ice-cream flavors among total sales, let the distribution percentages be: Vanilla () and Blueberry ().
If the number of females who bought Vanilla ice-cream is more than the number of males who bought the same flavored ice-cream, and for Blueberry ice-cream, the number of females is more than males, find the number of females who purchased Blueberry ice-cream.
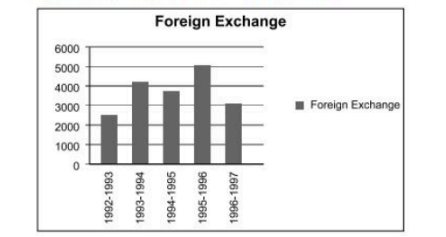
By analyzing the data below representing foreign exchange reserves, answer the question:
For which year is the percentage increase of foreign exchange reserves over the previous year the highest?
Examine the table and answer the question.
Number of Candidates Appeared and Qualified in a Competitive Examination from Different States Over the Years:
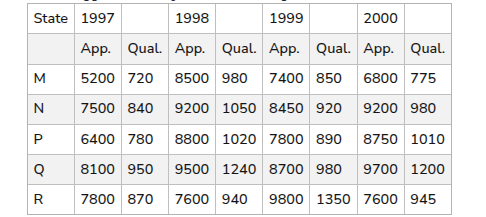
Total number of candidates qualified from all the states together in 1998 is approximately what percentage of the total number of candidates qualified from all the states together in 2000?
Number of Candidates Appeared and Qualified in a Competitive Examination from Different States Over the Years:
Total number of candidates qualified from all the states together in 1998 is approximately what percentage of the total number of candidates qualified from all the states together in 2000?
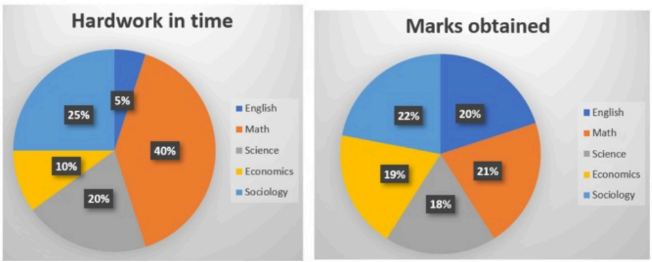
A student has 5 subjects in an examination. The distribution of hard work of 16 hours a day over 5 subjects and marks obtained 400 out of 500 are shown in the charts. In which subject did the student get the highest outcome of the hard work (ratio of marks to hard work is highest)?
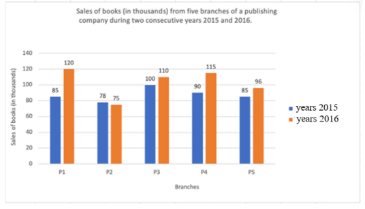
The bar graph given below shows the sales of books (in thousands) from five branches of a publishing company during two consecutive years 2015 and 2016. What percentage (rounded off to 2 decimal places) of the average sales of branches P1, P3 and P5 in 2016 is the average sales of branches P1, P2, P3 and P4 in 2015?
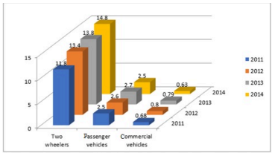
The given chart represents the sales of automobiles in India (by type, in million units) from the year 2011 to 2014. The number of commercial vehicles sold in 2012 was approximately what percentage of the total number of vehicles sold in 2011? (Correct to two decimal places)
Total number of students in different subjects of a college and percentage of girls and boys are shown in the below table. Girl students and boy students are NOT having multiple subjects.
Subjects Number of Students Girls % Boys %
Mathematics 840 40 60
Chemistry 220 70 30
Physics 450 30 70
Biology 200 80 20
What is the ratio of girl students of Mathematics and Chemistry to the number of boy students of Physics and Biology?
Subjects Number of Students Girls % Boys %
Mathematics 840 40 60
Chemistry 220 70 30
Physics 450 30 70
Biology 200 80 20
What is the ratio of girl students of Mathematics and Chemistry to the number of boy students of Physics and Biology?
Competitive Exam Data Interpretation — FAQ
How many Data Interpretation questions come in Competitive Exam?▼
Our database has 87 Data Interpretation questions from Competitive Exam covering 2026 to 2026.
What difficulty are Competitive Exam Data Interpretation questions?▼
The 87 Competitive Exam Data Interpretation questions include 5 easy, 81 medium and 1 hard level questions.
Where can I find more Data Interpretation questions for other exams?▼
Visit /tag/data-interpretation to see all Data Interpretation questions across all exams including SSC CGL, Staff Selection Commission, Prepp.