Prepp
Data Interpretation Questions
18 Data Interpretation questions from Prepp with detailed answers and explanations. Free previous year questions and MCQs.
📚
18
Questions
🟢
0
Easy
🟡
18
Medium
🔴
0
Hard
Years:2026 (18)
Data Interpretation — Prepp(1–18 of 18)
Filter:
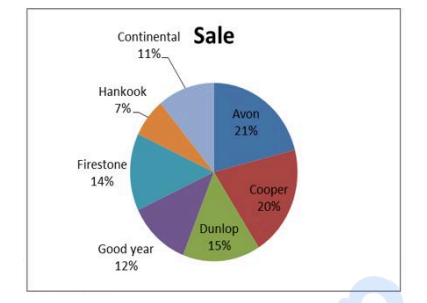
The percentage distribution of the number of tires of different brands produced by a specific factory in a year is shown in the given pie-chart. The total number of tires sold is 1350.
What is the difference between the average number of Avon and Firestone tires sold together and the average number of Good year and Dunlop tires sold together?
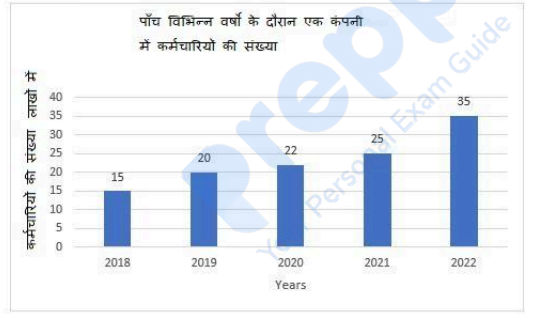
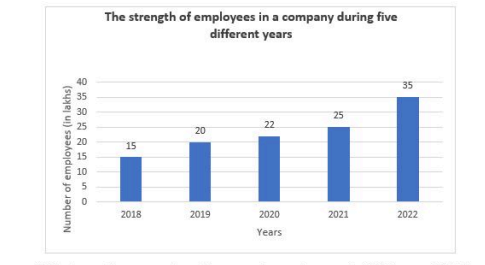
Study the given bar graph and answer the following question. The bar graph shows the number of employees (in lakhs) in a company across five different years:
By what percentage did the number of employees increase in the year 2022 compared to the year 2019?
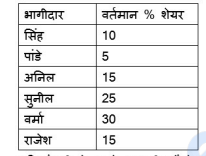
Study the data given below and answer the following question. The table shows the current percentage share of 6 partners in a company:
If the company has issued shares among its 6 partners and if Verma offers to sell of his shares to Pandey, how many shares will Pandey have in total?
Study the given table and answer the following question. The table shows the number of students studying in 6 different classes of 6 different schools:
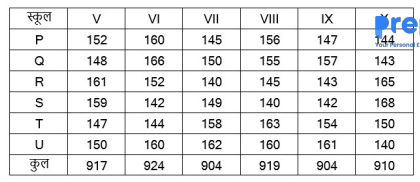
The number of students studying in class X from school P is approximately what percent of the total number of students studying in class X from all schools together?
The number of students studying in class X from school P is approximately what percent of the total number of students studying in class X from all schools together?
The following table shows the classification of 100 students based on the marks obtained by them in Mathematics and Science in an examination:
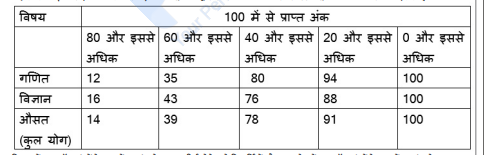
What is the difference between the number of students passing with 60 as cut-off marks in Science and those passing with 60 as cut-off marks in Average (Total)?
What is the difference between the number of students passing with 60 as cut-off marks in Science and those passing with 60 as cut-off marks in Average (Total)?
The table represents marks obtained by students A, B, C, D and E in five subjects in an examination. The maximum marks for each subject are 100.
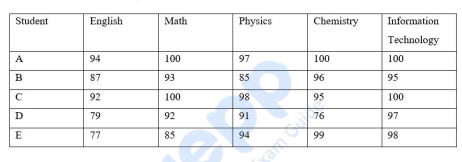
In how many subjects have the students scored 100% marks?
In how many subjects have the students scored 100% marks?
The following table shows the classification of 100 students based on the marks obtained by them in Maths and Science in an examination.
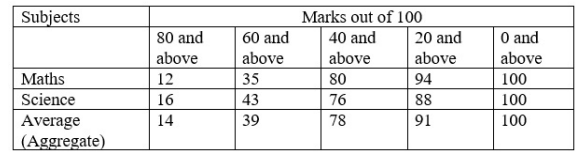
What is the difference between the number of students who passed with 60 as cut-off marks in Science and those who passed with 60 as cut-off marks in aggregate?
What is the difference between the number of students who passed with 60 as cut-off marks in Science and those who passed with 60 as cut-off marks in aggregate?
Study the given table and answer the question that follows.
The table shows the percentage population of four states below poverty line and the proportion of male to female.
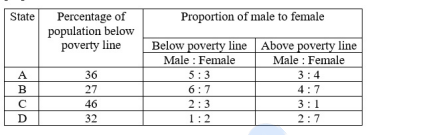
If the population of states A and D is each, then what is the total number of females below the poverty line in these states combined?
The table shows the percentage population of four states below poverty line and the proportion of male to female.
If the population of states A and D is each, then what is the total number of females below the poverty line in these states combined?
The given pie chart shows the percentage distribution of a mathematics book in 5 different stores (P, Q, R, S, and T). The total number of books is . Find the central angle for the book in store S.
* P:
* Q:
* R:
* S:
* T:
* P:
* Q:
* R:
* S:
* T:
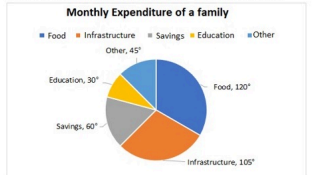
The savings and expenditure of a family in a month on different heads is shown in the given pie chart. The family saves ₹ 8,000 per month. Find the expenditure (in ₹) on education.
Study the given table and answer the question that follows. The table shows the yearly production (in thousands) of scooters in five different factories (P, Q, R, S and T) from to :
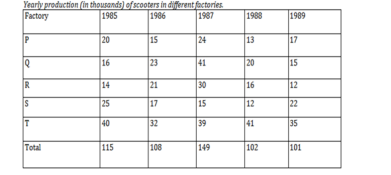
In which year was the production of scooters in all factories equal to the yearly average number of scooters produced from to ?
In which year was the production of scooters in all factories equal to the yearly average number of scooters produced from to ?
Based on the following table which shows production of the number of scooters by a company during the first half of 1992.
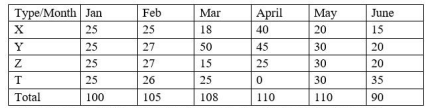
In which month, did the company produce an equal number of all types of scooters?
In which month, did the company produce an equal number of all types of scooters?
The following pictograph table shows the number of scouts in a school across different classes:
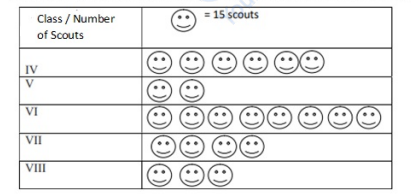
If each Smiley Face represents , what is the total number of scouts in classes VI to VIII?
If each Smiley Face represents , what is the total number of scouts in classes VI to VIII?
The percentage distribution of the number of tires of different brands produced in a year by a certain factory is shown in a pie chart with the following distribution: Avon , Cooper , Dunlop , Good year , Firestone , Hankook , and Continental . If the total number of tires sold is ,
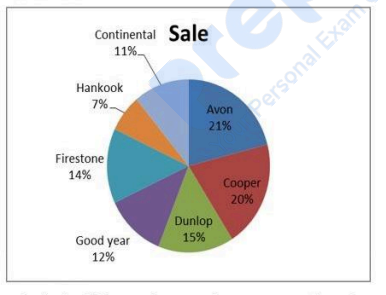
what is the difference between the average number of Avon and Firestone tires sold together and the average number of Good year and Dunlop tires sold together?
what is the difference between the average number of Avon and Firestone tires sold together and the average number of Good year and Dunlop tires sold together?
The following table shows the number of students studying in 6 different classes of 6 different schools:
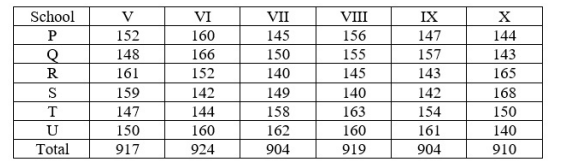
The number of students studying in class X from school P forms approximately what percentage of the total number of students studying in class X from all schools together?
The number of students studying in class X from school P forms approximately what percentage of the total number of students studying in class X from all schools together?
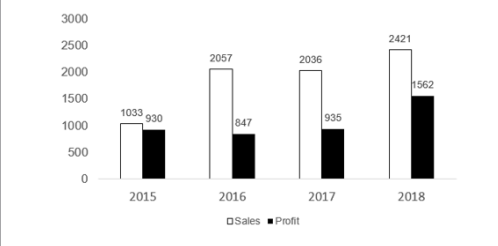
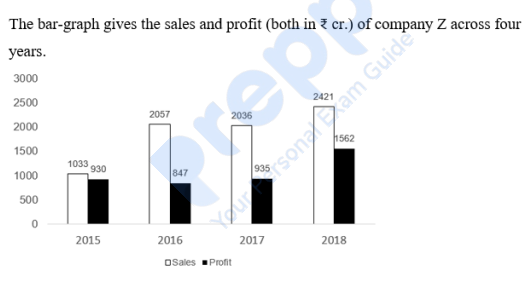
Based on the bar-graph provided in image_80f91d.png showing the sales and profit (both in ) of company Z across four years, what was the approximate percentage profit margin on revenue of company Z in 2016?
Prepp Data Interpretation — FAQ
How many Data Interpretation questions come in Prepp?▼
Our database has 18 Data Interpretation questions from Prepp covering 2026 to 2026.
What difficulty are Prepp Data Interpretation questions?▼
The 18 Prepp Data Interpretation questions include 0 easy, 18 medium and 0 hard level questions.
Where can I find more Data Interpretation questions for other exams?▼
Visit /tag/data-interpretation to see all Data Interpretation questions across all exams including SSC CGL, Competitive Exam, Staff Selection Commission.