AIEEE
Modern Physics Questions
38 Modern Physics questions from AIEEE with detailed answers and explanations. Free previous year questions and MCQs.
📚
38
Questions
🟢
9
Easy
🟡
23
Medium
🔴
6
Hard
Years:2026 (38)
Modern Physics — AIEEE(1–38 of 38)
Filter:
The binding energy per nucleon of deuteron () and helium nucleus () is and respectively. If two deuteron nuclei react to form a single helium nucleus, then the energy released is:
A nucleus disintegrates into two nuclear parts which have their velocities in the ratio . The ratio of their nuclear sizes will be:
The work function of a substance is . Then the longest wavelength of light that can cause photoelectron emission from this substance is approximately:
According to Einstein’s photoelectric equation, the plot of the kinetic energy of the emitted photo electrons from a metal vs the frequency of the incident radiation gives a straight line whose slope:
An -particle of energy is scattered through by a fixed uranium nucleus (). The distance of the closest approach is of the order of:
The time taken by a photoelectron to come out after the photon strikes is approximately:
The threshold frequency for a metallic surface corresponds to an energy of , and the stopping potential for a radiation incident on this surface is . The incident radiation lies in the:
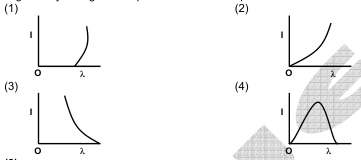
The anode voltage of a photocell is kept fixed. The wavelength of the light falling on the cathode is gradually changed. The plate current of the photocell varies as follows:
A photon of frequency has a momentum associated with it. If is the velocity of light, the momentum is:
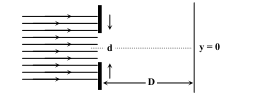
In an experiment, electrons pass through a narrow slit of width ‘ ’. They are detected on a screen at a distance ‘ ’. Which graph correctly represents the number of electrons detected as a function of the detector position ( corresponds to the middle of the slit)?
Suppose an electron is attracted towards the origin by a force where is a constant. By applying Bohr model, the radius and kinetic energy of the orbital are:
Statement 1: Davisson-Germer experiment established the wave nature of electrons.Statement 2: If electrons have wave nature, they can interfere and show diffraction.
Electrons accelerated by potential are diffracted from a crystal. If and , should be about ():
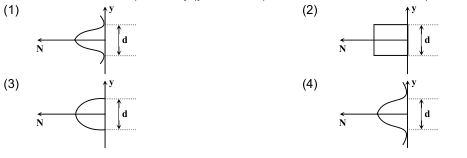
If a strong diffraction peak is observed when electrons are incident at an angle ‘ ’ from the normal to the crystal planes with distance ‘ ’ between them, de Broglie wavelength of electrons can be calculated by the relationship ( is an integer):
Statement - 1: Energy is released when heavy nuclei undergo fission or light nuclei undergo fusion.Statement - 2: For heavy nuclei, binding energy per nucleon increases with increasing while for light nuclei it decreases with increasing .
The surface of a metal is illuminated with the light of . The kinetic energy of the ejected photoelectrons was found to be . The work function of the metal is ():
Statement-1: When ultraviolet light is incident on a photocell, its stopping potential is and the maximum kinetic energy of the photoelectrons is . When the ultraviolet light is replaced by X-rays, both and increase.Statement-2: Photoelectrons are emitted with speeds ranging from zero to a maximum value because of the range of frequencies present in the incident light.
If a source of power produces photons/second, the radiation belongs to a part of the spectrum called:
The half life of a radioactive substance is . The approximate time interval between the time when of it has decayed and time when of it had decayed is:
Statement-1 : A metallic surface is irradiated by a monochromatic light of frequency (the threshold frequency). The maximum kinetic energy and the stopping potential are and respectively. If the frequency incident on the surface is doubled, both the and are also doubled.Statement-2 : The maximum kinetic energy and the stopping potential of photoelectrons emitted from a surface are linearly dependent on the frequency of incident light.
Hydrogen atom is excited from ground state to another state with principal quantum number equal to 4. Then the number of spectral lines in the emission spectra will be:
The electrical conductivity of a semiconductor increases when electromagnetic radiation of wavelength shorter than is incident on it. The band gap in () for the semiconductor is:
If the binding energy of the electron in a hydrogen atom is , the energy required to remove the electron from the first excited state of is:
The wavelengths involved in the spectrum of deuterium () are slightly different from that of hydrogen spectrum, because:
In the nuclear fusion reaction , given that the repulsive potential energy between the two nuclei is , the temperature at which the gases must be heated to initiate the reaction is nearly: (Boltzmann’s constant )
Which of the following cannot be emitted by radioactive substance during their decay?
Two identical photo cathodes receive light of frequencies and . If the velocities of the photoelectrons (of mass ) coming out are respectively and , then:
A nucleus with emits the following in a sequence: . The of the resulting nucleus is:
A radioactive sample at any instant has its disintegration rate . After , the rate is . Then, the decay constant (per minute) is:
When nucleus originally at rest, decays by emitting an alpha particle having a speed , the recoil speed of the residual nucleus is:
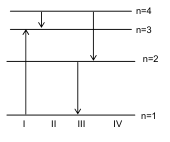
The diagram shows the energy levels for an electron in a certain atom. Which transition shown represents the emission of a photon with the most energy?
If the kinetic energy of a free electron doubles. Its de Broglie wavelength changes by the factor:
Starting with a sample of pure , of it decays into in . The corresponding half-life is:
If radius of nucleus is estimated to be then the radius nucleus be nearly:
A photocell is illuminated by a small bright source placed away. When the same source of light is placed away, the number of electrons emitted by photo cathode would:
AIEEE Modern Physics — FAQ
How many Modern Physics questions come in AIEEE?▼
Our database has 38 Modern Physics questions from AIEEE covering 2026 to 2026.
What difficulty are AIEEE Modern Physics questions?▼
The 38 AIEEE Modern Physics questions include 9 easy, 23 medium and 6 hard level questions.
Where can I find more Modern Physics questions for other exams?▼
Visit /tag/modern-physics to see all Modern Physics questions across all exams including Physics, AIEEE 2003, AIEEE 2004.