Percentages Questions
Practice 279 Percentages questions with detailed answers and explanations. Free MCQs, PYQs, and mock test questions for NEET, JEE, GATE, SSC and more.
📚
279
Total Questions
🟢
17
Easy
🟡
259
Medium
🔴
3
Hard
Page 2 of 3(101–200 of 279)
3 pages
Filter:
If the radius of a circle is increased by 12% then its area increases by:
Between 10pm to 6am, a fitness band records the following percentage data. How long was the user in Light sleep or in Extremely light sleep?
Sleep State Percentage
Deep Sleep 10%
Dreaming 20%
Light sleep 15%
Extremely light sleep 25%
Awake 30%
Sleep State Percentage
Deep Sleep 10%
Dreaming 20%
Light sleep 15%
Extremely light sleep 25%
Awake 30%
Arun bought a cycle for and then sold it for . What is his profit percentage?
In an election, the winner was supported by of all the voters in the list, and he got votes more than his only rival. of the voters on the voters' list did not cast their votes, and voters cast their ballot papers blank. How many voters were on the list?
The table shows the marks obtained by five students in Mathematics and Physics. Refer to the table to answer the question.
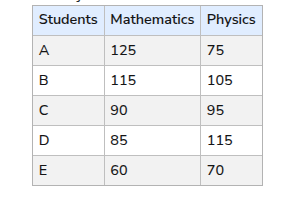
If the marks obtained by E in Mathematics are increased by of the original marks, what will be his new percentage in Mathematics, assuming the maximum marks are ?
If the marks obtained by E in Mathematics are increased by of the original marks, what will be his new percentage in Mathematics, assuming the maximum marks are ?
Two students appeared for an examination. One of them secured 21 marks more than the other and his marks were 80% of the sum of their marks. The marks obtained by them are:
A mixture of of alloy of copper and tin contains tin. How much tin must be added so that it becomes of the mixture?
Riya invests ₹ in a savings account that offers an annual compound interest rate of , compounded yearly. How much money will she have in the account after years?
Refer the below data table and answer the following Question.
India's exports in 2015 Value in million US$
Jewellery 1000
Software 725
Cotton 700
Steel 700
Electronics 700
Jewellery was what percent of total exports?
India's exports in 2015 Value in million US$
Jewellery 1000
Software 725
Cotton 700
Steel 700
Electronics 700
Jewellery was what percent of total exports?
If of is , then what is the value of ?
Manik marks the price of his toys above the cost price. If he allows a discount, then what is the profit or loss percentage?
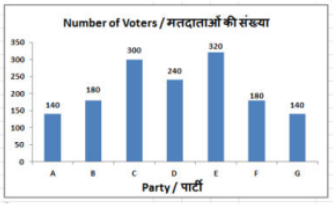
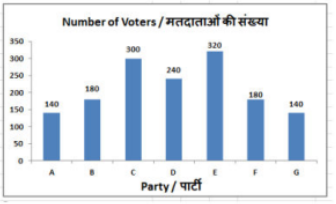
Comprehension:The following detailed list shows the results of a survey where people exiting voting booths were asked for which party they voted:Party A: votesParty B: votesParty C: votesParty D: votesParty E: votesParty F: votesParty G: votesIf of voters of party C had voted for party B instead, then party B's voters would have increased by _______.
There were two candidates in the election. of voters did not cast their votes. votes were found invalid. The winning candidate got of the total votes and won by votes. Find the number of voters enrolled.
By selling a tape-recorder for , I lost . What percent shall I gain by selling it for ?
Find a single discount rate percentage equivalent to the successive discounts of , , and .
The rice sold by a grocer contained 20% of low-quality rice. What quantity of good-quality rice should be added to 175 kg of mixed rice so that the percentage of low-quality rice remains 10%?
Tourists visiting a hill station during the selected months are as follows:
May: 4000, June: 5200, July: 6000, August: 5500.
What is the percentage increase in tourists from May to July?
May: 4000, June: 5200, July: 6000, August: 5500.
What is the percentage increase in tourists from May to July?
Two numbers are 35% and 50% lesser than a third number. By how much percent is the second number to be enhanced to make it equal to the first number?
Refer to the below data table and answer the following question.
The average of twenty positive numbers is . If each number increases by , then will:
If two-fifth of three-eighth of one-sixth of a certain number is 52, what is 40% of the number?
In a chief election, a candidate got of the total valid votes. of the total votes were declared invalid. If the total number of votes is , then the number of valid votes polled in favour of the candidate is:
In measuring the sides of a rectangle, one side is taken 10% in excess, and the other 8% in deficit. The error percent in the area calculated from these measurements is:
The price of a mobile is ₹15,000. During the annual sale, its price decreased in the ratio of 8:5. What is its decreased price (in ₹)?
Ramesh spends 60% of his income. If his income is increased by 30% and his expenditure is increased by 20%, then the percentage increase in the savings of Ramesh will be:
48% of the total marks is required to pass an examination and 80% to get a First Class with distinction. A student scored 817 marks and failed by 47 marks. How many marks should he secure to get First Class with distinction?
The annual profit percentage earned by a telephone company during the period 2015-2020 is given in the following table. The profit percentage is calculated by the difference between income and expenditure over expenditure. Study the table and answer the question that follows.
There are twice as many girls as boys in a class. If 45% of the girls and 30% of the boys have submitted their consent for the outstation tour, then what per cent of the students have NOT submitted consent for the tour?
In an election, there were only two candidates. 12% of the voters did not cast their votes. The winner by obtaining 60% of the total votes defeated his opposite contestant by 1200 votes. Find the total number of votes.
By what percentage is 74% of 1894 more than 39% of the same number (correct to two decimal places)?
If the GST on a certain article was Rs. 600 two years back and it increased to Rs. 750 this year, find the percentage increase in the GST on that article.
A seller sells two shirts for Rs. 3,360. The cost of four such shirts for the shopkeeper was Rs. 5,600. What is the profit/loss percentage on each shirt?
Yashwant buys candies at 15 for Rs. 40 and sells them at 30 for Rs. 50. What is his gain or loss percent?
The average salary of male employees in a firm was and that of female employees was . If the mean salary of the employees was , what was the percentage of female employees?
Refer to the below data table and answer the following question.
Partners Present % share
Anand 15
Basu 5
Chinmay 15
Dhiraj 20
Ejaz 45
If the company has issued six lakh (6,00000) shares between its five partners and if Basu offers to sell 15,000 of his shares to Ejaz, then Ejaz will have how many shares?
Partners Present % share
Anand 15
Basu 5
Chinmay 15
Dhiraj 20
Ejaz 45
If the company has issued six lakh (6,00000) shares between its five partners and if Basu offers to sell 15,000 of his shares to Ejaz, then Ejaz will have how many shares?
In an office, of the staff is female. of the female staff and of the male staff are married. The percentage of the unmarried staff in the office is:
A chair is bought for ₹600 and sold for ₹750. Find the profit percentage.
Abhay can do a work in 22 days. Nidhi is 28% more efficient than Abhay. The number of days Nidhi will take to do the same piece of work is:
A student scores in an examination. The scores were , , and in subjects. Find the student's score in the subject.
Some articles were marked above their cost price. One of such articles was sold at profit on the marked price and the other one was sold at loss on the marked price. Find the overall percentage profit.
In a constituency, the total number of people on the electoral roll was 2,75,000. Out of them, 90% cast their votes in an election and 15% of the votes cast were declared invalid. What was the number of valid votes cast?
If 36 litres of 20% milk solution is mixed with 48 litres of 10% milk solution, then what will be the percentage concentration of milk in the final solution?
The number of toys manufactured by a machine in 2018 was 25,000, which increased by 20% in 2019. In 2020, the production was hindered by a strike and it fell by 15%. How many total toys were manufactured in three years by the machine?
Mohan purchases a table at an MRP of Rs. 800, at a discount of 10%. If he sells it at Rs. 900, then the profit percentage is:
Akshara scores 85% in five subjects together. The subjects are Hindi, Science, Mathematics, English and Computers, where the maximum marks of each subject are 100. Akshara scores 75 marks in Hindi, 92 marks in Computers, 89 marks in Mathematics, and 81 marks in English. How many marks did Akshara score in Science?
The following chart represents the demand and production of five companies V, W, X, Y and Z.
If K% of the production of company W equals the production of company Z, then K equals:
(Note: Based on the standard exam data for this problem, the production of company W is 40 units and the production of company Z is 60 units.)
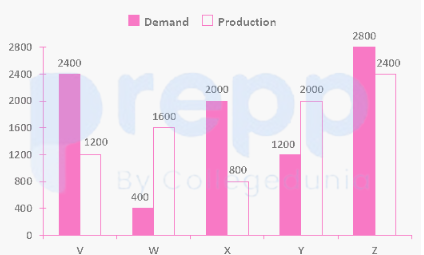
If K% of the production of company W equals the production of company Z, then K equals:
(Note: Based on the standard exam data for this problem, the production of company W is 40 units and the production of company Z is 60 units.)
If decreasing 90 by k% gives the same result as increasing 60 by k%, then k% of 120 is how much percent of [(k+20)% of 150]?
By selling a tape-recorder for , I lost . What percent shall I gain by selling it for ?
Two numbers and are respectively and less than a third number . By what percentage is the number less than the number ?
If the numerator of a fraction is increased by 12% and its denominator is reduced by 8%, it gives a new fraction
17
16
. What is the original fraction?
17
16
. What is the original fraction?
A person bought a laptop for and sold it at a profit of . What is the selling price of the laptop?
Refer to the below data table and answer the following question.
Items / वस्तु Yearly Expense in Rs lakhs / लाख रुपये में वार्षिक खर्च
Raw Materials / कच्चा माल 6
Labour / श्रम 3
Rent / किराया 5
Interest / ब्याज 6
Taxes / कर 3
Rent and Taxes are what percent of total expenses?
Items / वस्तु Yearly Expense in Rs lakhs / लाख रुपये में वार्षिक खर्च
Raw Materials / कच्चा माल 6
Labour / श्रम 3
Rent / किराया 5
Interest / ब्याज 6
Taxes / कर 3
Rent and Taxes are what percent of total expenses?
In an election between two candidates, 75% of the voters cast their votes, out of which 2% of the votes were declared invalid. A candidate got 9,261 votes, which were 75% of the total valid votes. Find the total number of votes.
A sports store offers a discount on its goods. The store offers a further discount of on the reduced price to those customers who pay by credit cards. If a customer wants to purchase a ball for and pays through a credit card, the amount (in ) to be paid by the customer is:
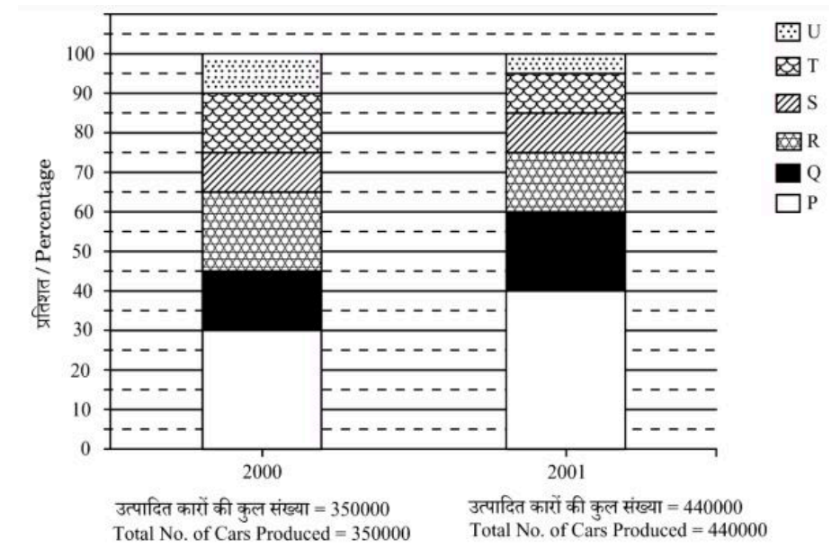
The chart shows the percentage distribution of six different types of cars (P, Q, R, S, T, U) manufactured by a company over two years. In 2000, the total production was cars, and the percentage of P-type cars was . If the total production in 2001 was cars, and the percentage production of P-type cars in 2001 remained the same as that in 2000, what would be the number of P-type cars produced in 2001?
Sanjeeb's salary was first reduced by and then increased by . What percentage of his salary does he lose?
A shopkeeper by selling 20 Timex watches, earns a profit equal to the selling price of 4 Timex watches. His profit percentage is:
of Ranita’s weekly income is equal to of Bhaskar’s weekly income. If Ranita’s weekly income was reduced by , while Bhaskar’s weekly income did not change, the ratio of the weekly incomes of Ranita and Bhaskar, respectively, would have been . What is Bhaskar’s weekly income (in )?
Refer the below data table and answer the following Question.
Sleep Stage Percentage
Deep Sleep 25
Dreaming 5
Light sleep 10
Extremely light sleep 5
Awake 55
Between 10pm to 6am, a fitness band records the following data. How long was the user Dreaming or was in Extremely light sleep?
Sleep Stage Percentage
Deep Sleep 25
Dreaming 5
Light sleep 10
Extremely light sleep 5
Awake 55
Between 10pm to 6am, a fitness band records the following data. How long was the user Dreaming or was in Extremely light sleep?
If Rita's salary is more than Geeta's salary, then by what percent is Geeta's salary less than Rita's salary?
The marked price of an article is more than its cost price. If a discount of is given, what will be the profit percentage?
A person sold an article at a loss of . Had he sold it at a gain of , he would have received more. What is the cost price (in ) of the article?
After selling , a shopkeeper claims that he makes a profit equal to the selling price of . Find the profit percentage of the shopkeeper.
The line graph shows the number of vacancies for accountants in a certain company. The data points are: 2011: 40, 2012: 60, 2013: 30, 2014: 10, 2015: 50, 2016: 40, 2017: 70.
The number of vacancies in 2014 were lesser than that in 2015 by:
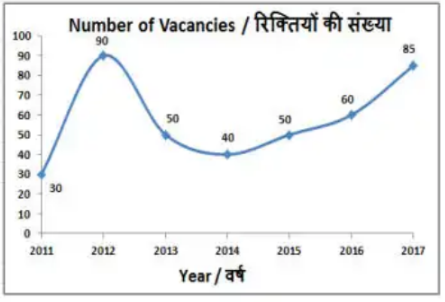
The number of vacancies in 2014 were lesser than that in 2015 by:
The price of petrol rises from Rs. 80 to Rs. 100. What is the percentage increase in price?
A college has raised of the amount it needs for a new building by receiving an average donation of \ 600 60\%$ of the people the college will ask for donations. If the college is to raise exactly the amount needed for the new building, what would be the average donation from the remaining people to be solicited?
of the voters in an election did not cast their votes. In this election, there were only two candidates. The winner, by obtaining of the total votes, defeated his contestant by . The total number of voters in the election was:
The cost price of milk is increased to ₹62 from ₹60. The milkman sold milk at 10% profit earlier. What is his profit now if he sells milk at the same rate?
Out of the total income, a family saves 15% and the rest of the amount is spent on three types of expenditure – health, education and food in the ratio of 1:2:2. The income is Rs. 300 less than thrice the expenditure incurred on education. What is the difference between the savings and the expenditure incurred on health?
The total emoluments of two persons are the same, but one gets allowances to the extent of of his basic pay and the other gets allowances to the extent of of his basic pay. The ratio of the basic pay of the former to the basic pay of the latter is:
Calculate the simple interest earned on a principal of ₹ at an annual interest rate of over a period of years.
A merchant buys an article for ₹ and sells it at a loss. What is the selling price of the article?
At what rate of compound interest per annum will a sum of ₹10000 become ₹12321 in 2 years?
The following table shows the number of students studying in 6 different classes of 6 different schools:
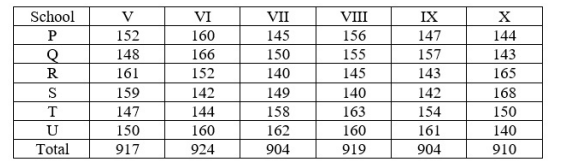
The number of students studying in class X from school P forms approximately what percentage of the total number of students studying in class X from all schools together?
The number of students studying in class X from school P forms approximately what percentage of the total number of students studying in class X from all schools together?
If 25% of X is equal to 40% of Y, then what is the ratio of X and Y?
A shopkeeper bought a television for ₹ and sold it for ₹ . Calculate the profit and profit percentage.
The difference between cost price and selling price is . If the loss percentage is , then what is the selling price (in )?
A, B and C are three numbers. If A exceeds B by 70% and B is 20% less than C, then A : C is:
Comprehension:The following detailed list shows the results of a survey where people exiting voting booths were asked for which party they voted:Party A: votesParty B: votesParty C: votesParty D: votesParty E: votesParty F: votesParty G: votesNumber of voters of party A were lesser than that of party C by _______.
Mobile phones sold by a store in six months are as follows:
January: 320, February: 280, March: 400, April: 360, May: 450, June: 390.
What is the percentage decrease in sales from May to June?
January: 320, February: 280, March: 400, April: 360, May: 450, June: 390.
What is the percentage decrease in sales from May to June?
Find the profit if you buy bananas at the rate of Rs. 10 dozen and sell them at the rate of 10 bananas at Rs. 12?
A number exceeds of itself by 60. The number is:
Ticket for an adult is Rs 1500 and a child is Rs 800. 1 child goes free with two adults. If a group has 25 adults and 12 children, what is the discount percentage the group gets?
What would be the interest accrued in two years if ₹ is invested @ interest compounded annually?
Shyam bought a chair for ₹1,563 and spent ₹350 on its repairing. He sold it for ₹2,398. Find his profit percentage (correct to two places of decimals).
If the difference between of a number and three fourth of that number is 63, then the number is:
If the side of a square is increased by , then percentage increase in its area will be:
If the ratio of cost price and selling price is , then the loss percent is
In a survey, of people preferred Option A and preferred Option B. If there were a total of respondents, how many of them preferred Option A?
Refer to the data below and answer the following question:
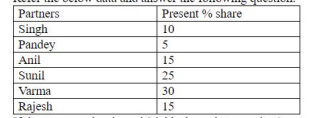
If the company has issued shares between its 6 partners and if Varma offers to sell of his shares to Pandey, then how many shares will Pandey have?
If the company has issued shares between its 6 partners and if Varma offers to sell of his shares to Pandey, then how many shares will Pandey have?
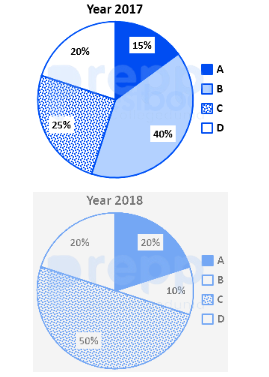
The given pie charts show the shares owned by the four partners of a certain company for the years 2017 and 2018. The company had issued 1000 shares that are now owned by the four partners. B sold some of his shares to A and C. If A paid Rs. 2,000 for each share, how much did B receive from C for the shares sold to C?
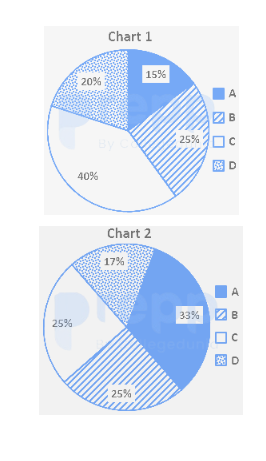
Pie chart (1) shows investments of lakh rupees by four partners in a certain business. Pie Chart (2) shows number of hours worked for the business by each partner. The business earned a profit of . Half of this profit is to be distributed between the 4 partners in proportion of investment and the rest in proportion of number of hours worked. How much will D get? (In lakh rupees)
The average score in a test for 50 students is 44. Out of the total students, 40% of the students are girls and the rest are boys. The average score of boys is 20% less than that of girls. What is the average score of girls?
A trader marked the price of a commodity to include a profit of but allowed a discount of on the marked price. What will be his actual profit?
Which of the following recorded the highest growth rate in manufacturing units from the year 2021 to the year 2022?
Plant Units manufactured in 2021 Units manufactured in 2022
A 150 175
B 225 269
C 300 315
D 130 169
E 150 172
Plant Units manufactured in 2021 Units manufactured in 2022
A 150 175
B 225 269
C 300 315
D 130 169
E 150 172
In an examination, there were two papers, A and B, and the maximum mark in each of the two papers was 10. However, the weights assigned to papers A and B were in the ratio 2: 1, respectively. Jonathan scored 8 out of 10 in Paper A and an overall 70% in the examination. How much did he score in Paper B out of 10?
Frequently Asked Questions
How many Percentages questions are on ExamTest.live?▼
We have 279 Percentages questions spread across 3 pages, covering easy, medium, and hard difficulty levels with detailed explanations.
Are Percentages MCQs free?▼
Yes. All Percentages questions, answers, and explanations on ExamTest.live are completely free. No account or subscription required.
Which exams include Percentages questions?▼
Percentages questions are commonly asked in Quantitative Aptitude, Data Interpretation, Mathematics, Mathematics and Science, Reasoning Ability. You can filter by exam using the links above.
How do I practice Percentages questions effectively?▼
Start with easy questions to build confidence, then tackle medium and hard ones. Use the filter buttons to sort by difficulty. Reveal the answer only after attempting each question, and read the explanation thoroughly.